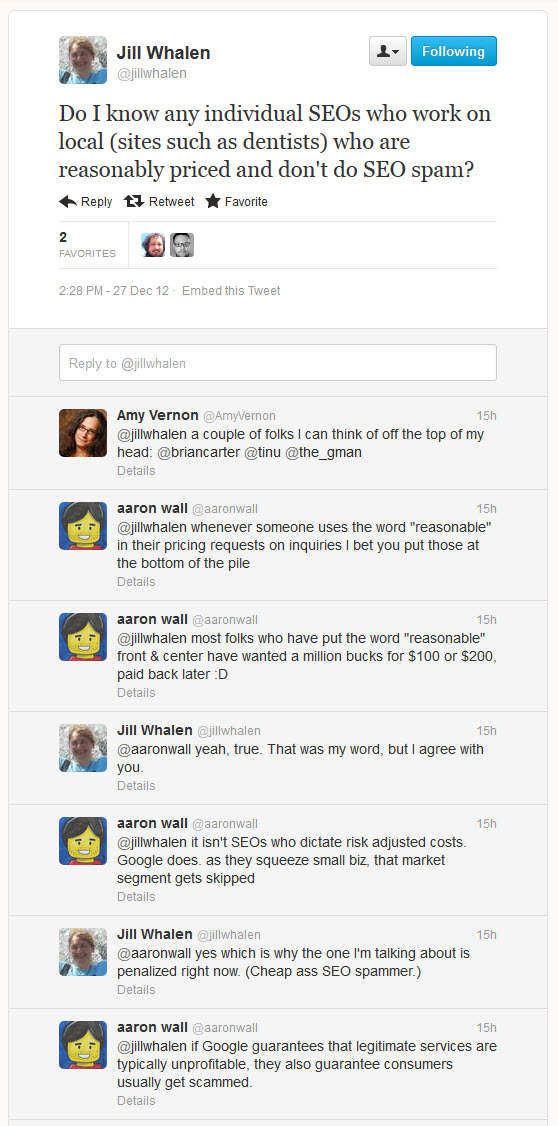
In our infographic about the sausage factory that is online journalism, we had a throw away line about how companies were partnering with FindTheBest to auto-generate subdomains full of recycled content. Apparently, a person named Brandon who claims to work for FindTheBest didn't think our information was accurate:
Hi Aaron,
My name is Brandon. I have been with FindTheBest since 2010 (right after our launch), and I am really bummed you posted this Infographic without reaching out to our team. We don't scrape data. We have a 40 person+ product team that works very closely with manufacturers, companies, and professionals to create useful information in a free and fair playing field. We some times use whole government databases, but it takes hundreds-of-thousands of hours to produce this content. We have a product manager that owns up to all the content in their vertical and takes the creation and maintenance very seriously. If you have any questions for them about how a piece of content was created, you should go to our team page and shoot them a email. Users can edit almost any listing, and we spend a ton of time approving or rejecting those edits. We do work with large publishers (something I am really proud of), but we certainly do not publish the same exact content. We allow the publishers to customize and edit the data presentation (look, style, feel) but since the majority of the content we produce is the factual data, it probably does look a little similar. Should we change the data? Should we not share our awesome content with as many users as possible? Not sure I can trust the rest of your "facts", but great graphics!
I thought it was only fair that we aired his view on the main blog.
...but then that got me into doing a bit of research about FindTheBest...
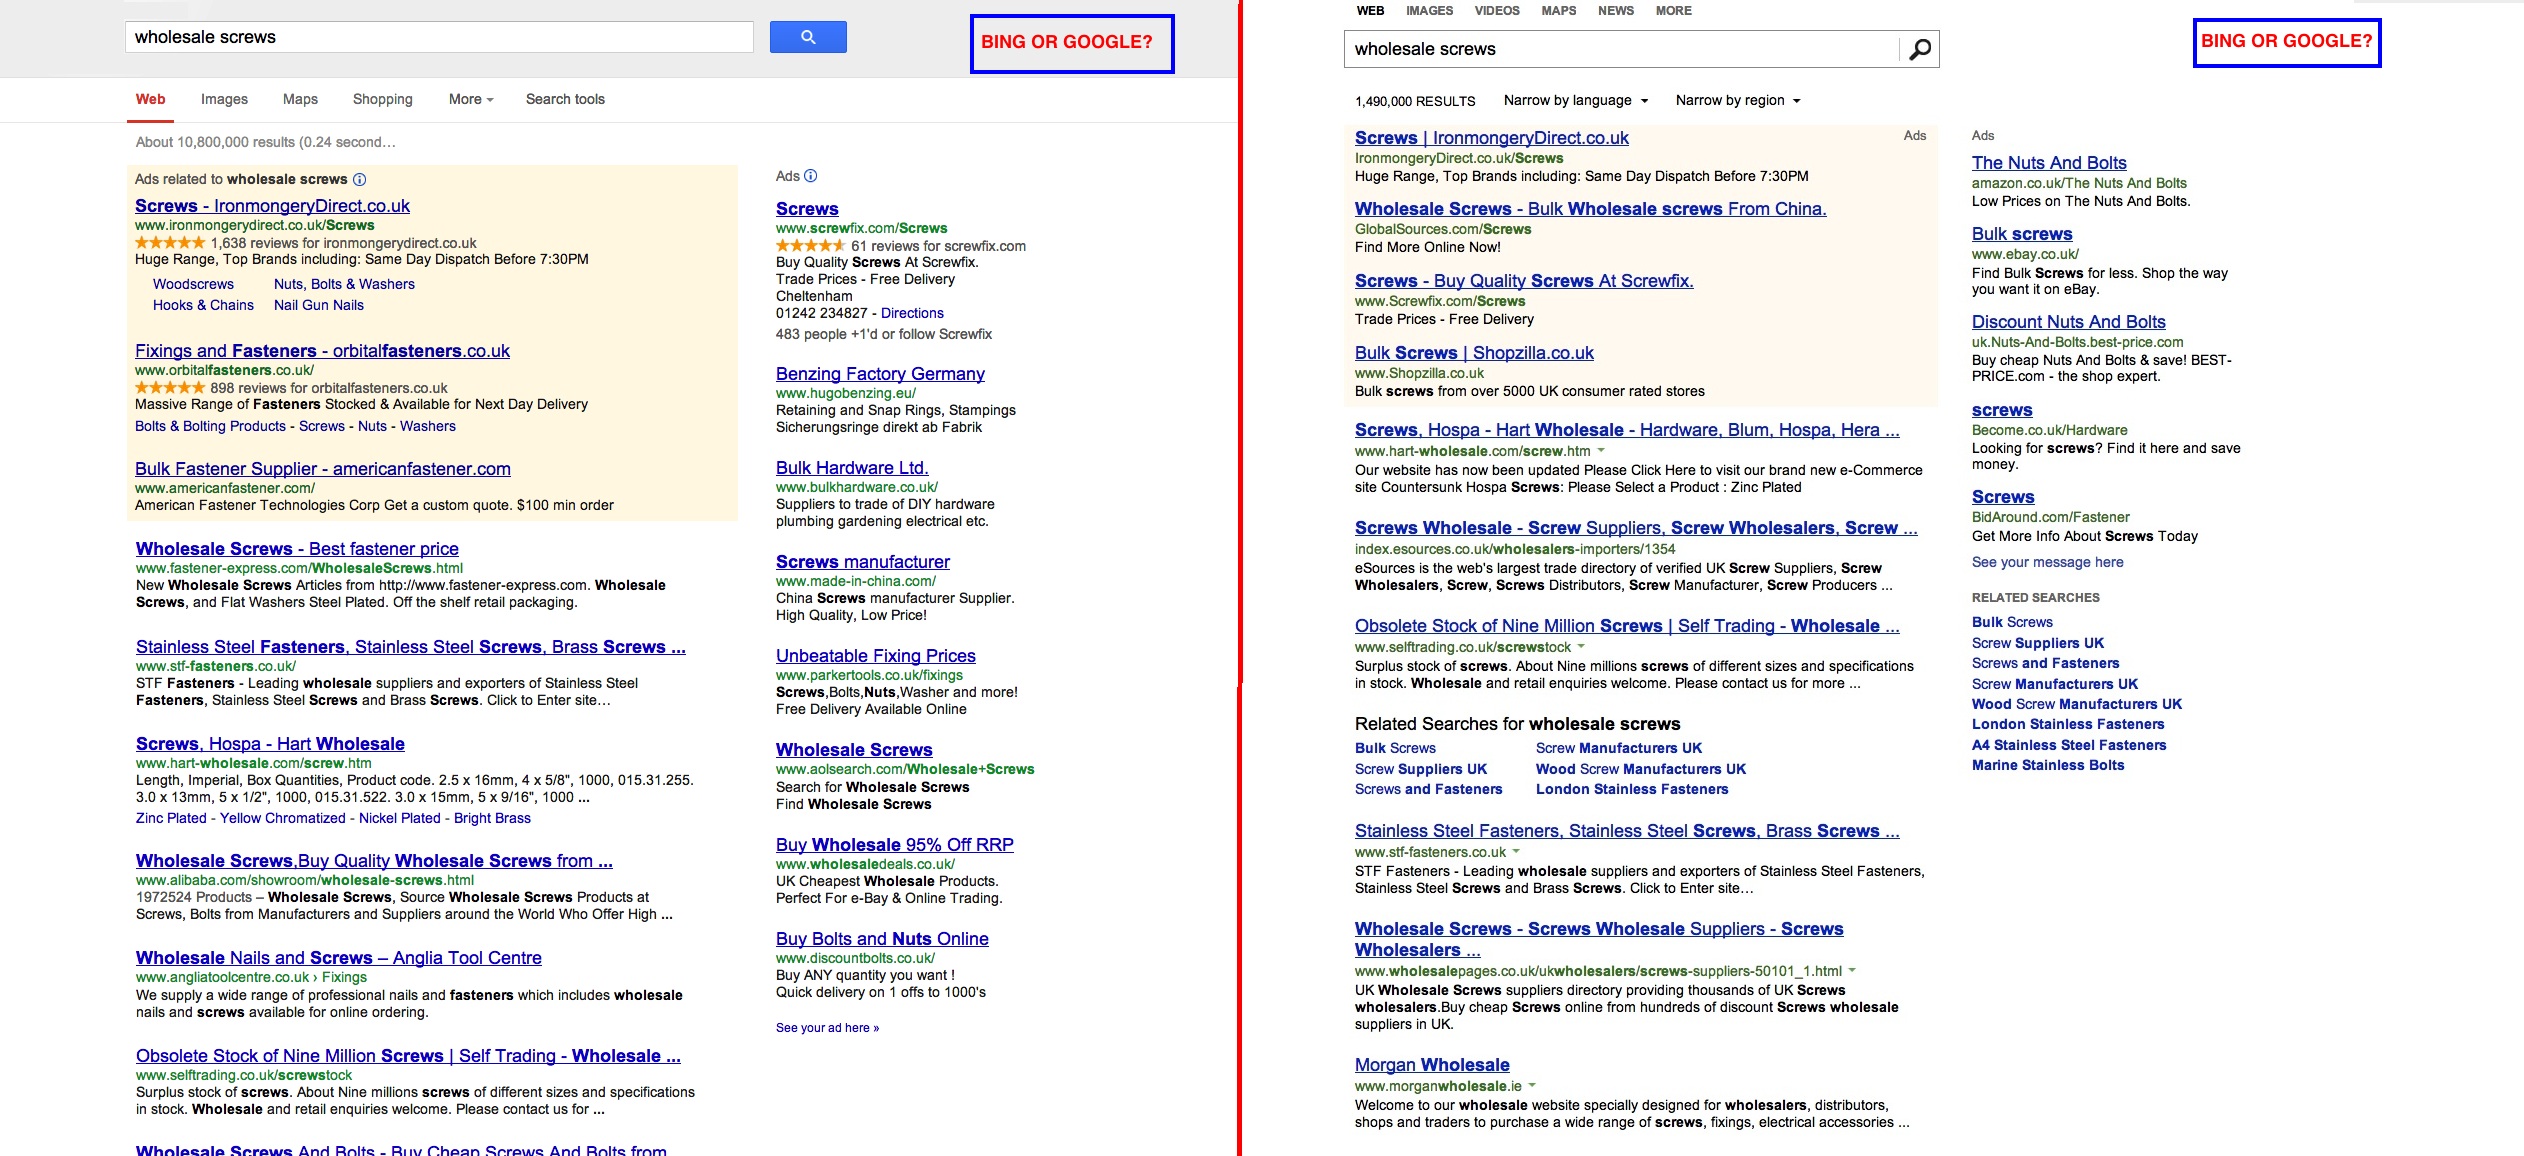
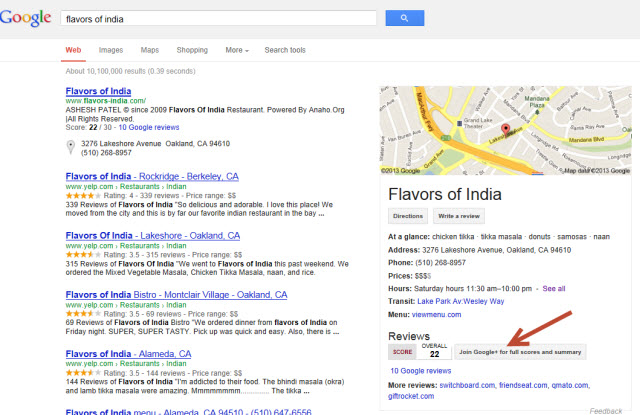
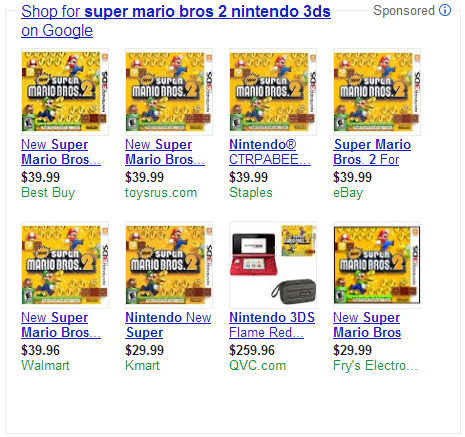
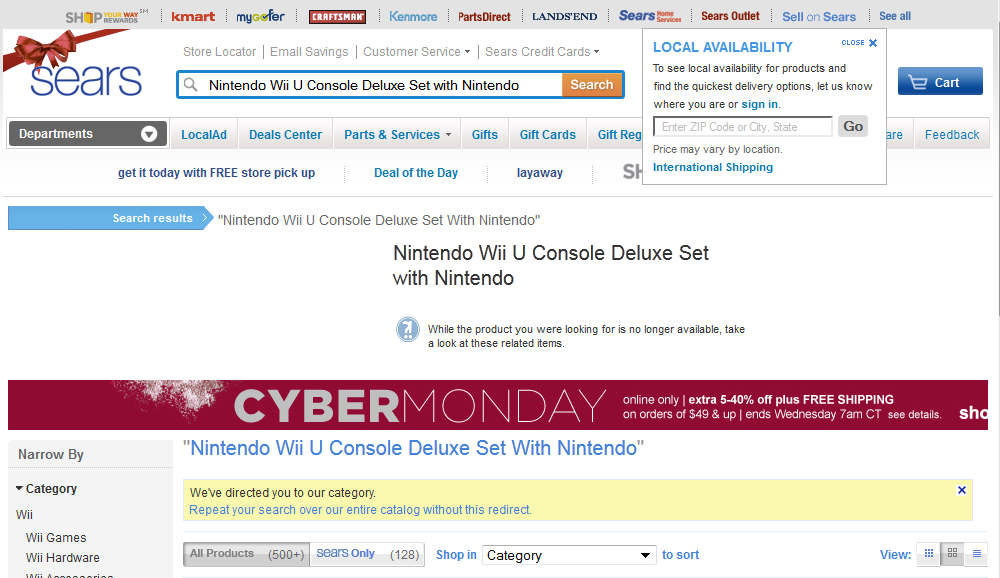
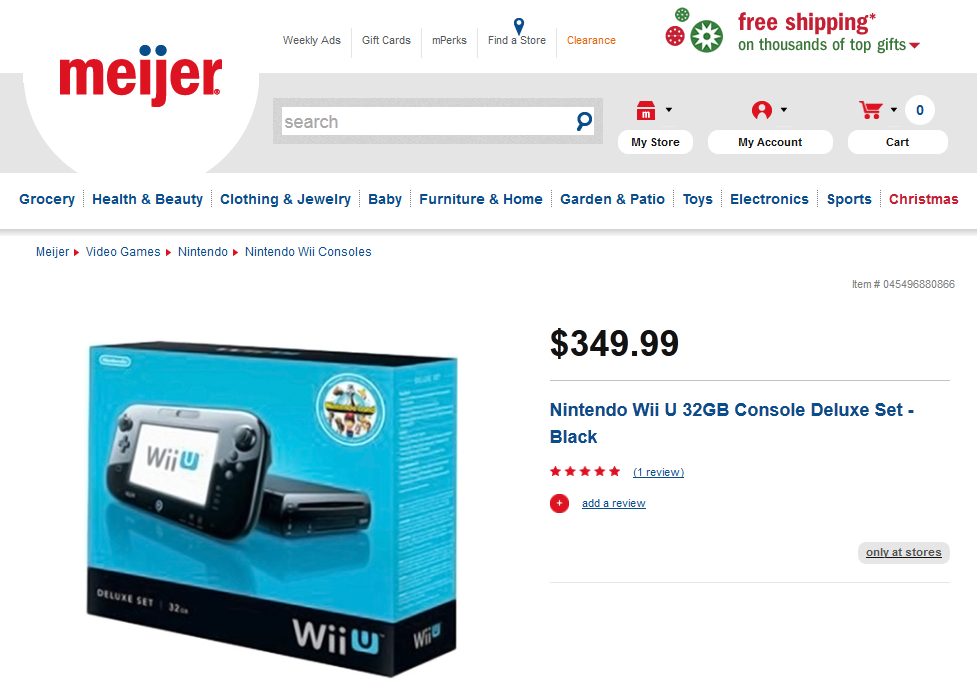
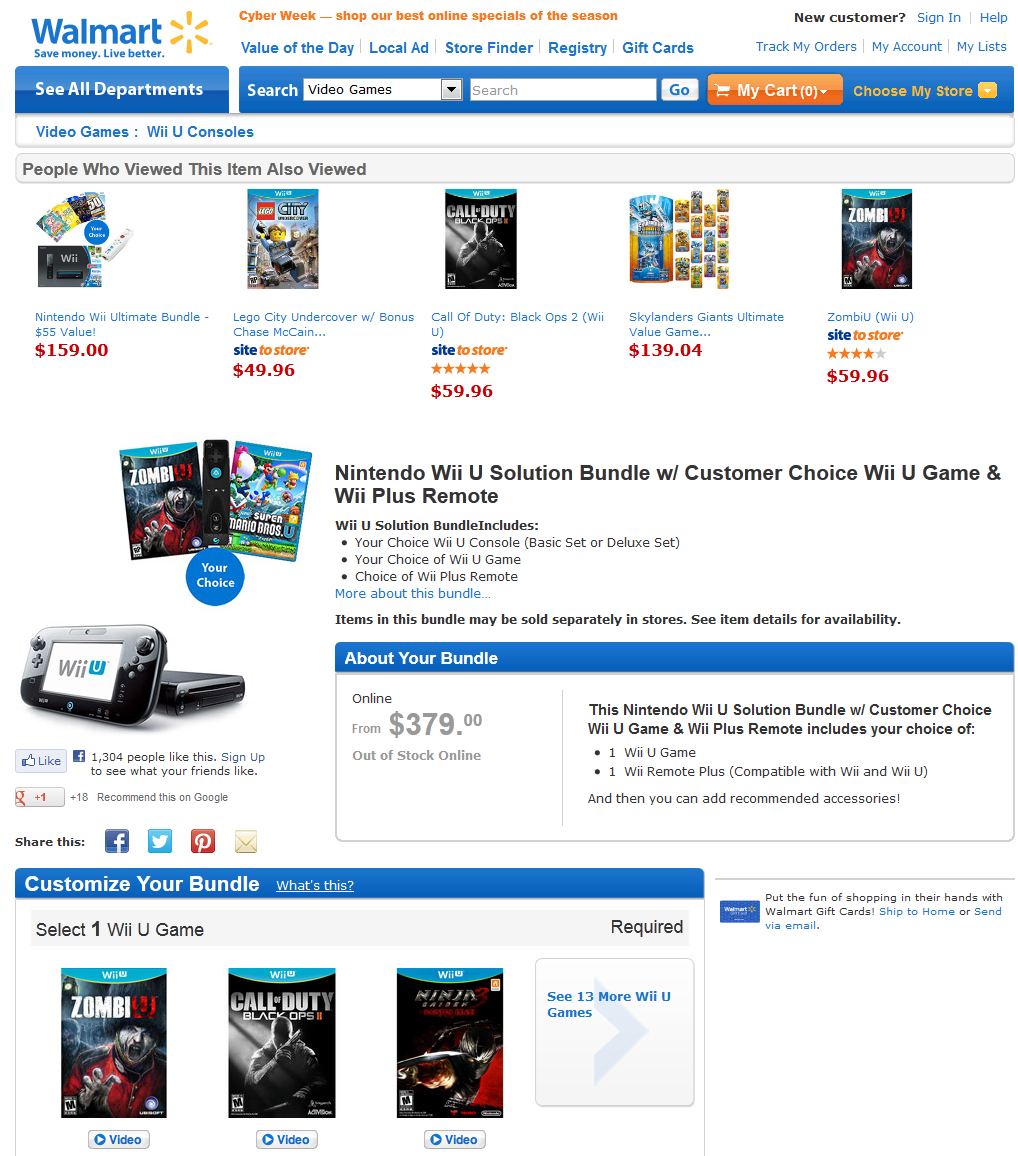
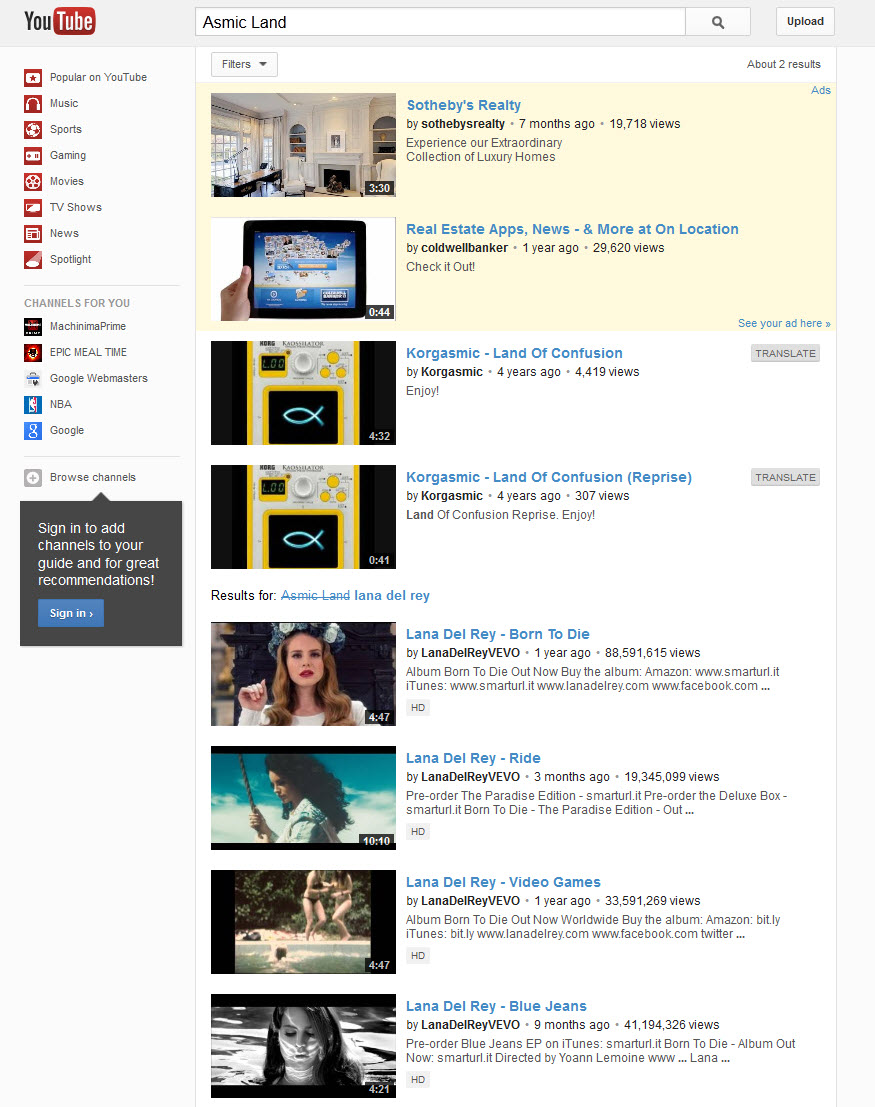
In the past when searching for an issue related to our TV I saw a SERP that looked like this
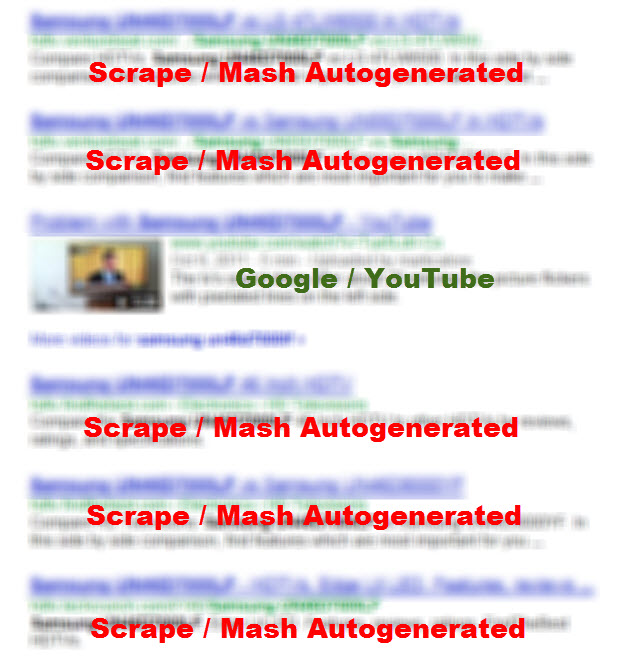
Those mashed sites were subdomains on trusted sites like VentureBeat & TechCrunch.
Graphically the comparison pages appear appealing, but how strong is the editorial?
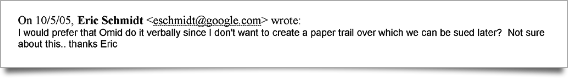
How does Find The Best describe their offering?
In a VentureBeat post (a FindTheBest content syndication partner) FTB's CEO Kevin O’Connor was quoted as saying: “‘Human’ is dirty — it’s not scalable.”
Hmm. Is that a counter view to the above claimed 40 person editorial research team? Let's dig in.
Looking at the top listed categories on the homepage of Find The best I counted 497 different verticals. So at 40 people on the editorial team that would mean that each person managed a dozen different verticals (if one doesn't count all the outreach and partnership buildings as part of editorial & one ignores the parallel sites for death records, grave locations, find the coupons, find the company & find the listing).

Google shows that they have indexed 35,000,000 pages from FindTheBest.com, so this would mean each employee has "curated" about 800,000 pages (which is at least 200,000 pages a year over the past 4 years). Assuming they work 200 days a year that means they ensure curation of at least 1,000 "high quality" pages per day (and this is just the stuff in Google's index on the main site...not including the stuff that is yet to be indexed, stuff indexed on 3rd party websites, or stuff indexed on FindTheCompanies.com, FindTheCoupons.com, FindTheListing, FindTheBest.es, FindTheBest.or.kr, or the death records or grave location sites).


Maybe I am still wrong to consider it a bulk scrape job. After all, it is not unreasonable to expect that a single person can edit 5,000 pages of high quality content daily.
Errr....then again...how many pages can you edit in a day?
Where they lost me though was with the "facts" angle. Speaking of not trusting the rest of "facts" ... how crappy is the business information for SEO Book on FindTheBest that mentions that our site launched in 2011, we have $58,000 in sales, and we are a book wholesaler.
I realize I am afforded the opportunity to work for free to fix the errors of the scrape job, but if a page is full of automated incorrect trash then maybe it shouldn't exist in the first place.
I am not saying that all pages on these sites are trash (some may be genuinely helpful), but I know if I automated content to the extent FTB does & then mass email other sites for syndication partnerships on the duplicate content (often full of incorrect information) that Google would have burned it to the ground already. They likely benefit from their CEO having sold DoubleClick to Google in the past & are exempt from the guidelines & editorial discrimination that the independent webmaster must deal with.
One of the ways you can tell if a company really cares about their product is by seeing if they dogfood it themselves.
Out of curiousity, I looked up FindTheBest on their FindTheCompany site.
They double-list themselves and neither profile is filled out.
That is like having 2 sentence of text on your "about us" page surrounded by 3 AdSense blocks. :D
I think they should worry about fixing the grotesque errors before worrying about "sharing with as many people as possible" but maybe I am just old fashioned.
Certainly they took a different approach ... one that I am sure that would get me burned if I tried it. An example sampling of some partner sites...
analytics-software.businessknowhow.com "BusinessKnowHow ended the relationship with find the best as soon as we realized how spammy they were." - Janet Attard- accountants.entrepreneur.com
- acronyms.sciencedaily.com
- alternative-fuel.cleantechnica.com
- antivirus.betanews.com
- apps.edudemic.com
- atvs.agriculture.com
- autopedia.com/TireSchool/
- autos.nydailynews.com
- backup-software.venturebeat.com
- bags.golfdigest.com
- beer.womenshealthmag.com
- best-run-states.247wallst.com
- bestcolleges.collegenews.com
- bikes.cxmagazine.com
- bikes.triathlete.com
- birds.findthelisting.com
- birth-control.shape.com
- brands.goodguide.com
- breast-pumps.parenting.com
- broker-dealers.minyanville.com
- businessschools.college-scholarships.com
- camcorders.techcrunch.com
- cars.pricequotes.com
- cats.petharbor.com
- catskiing.tetongravity.com
- chemical-elements.sciencedaily.com
- comets-astroids.sciencedaily.com
- companies.findthecompany.com
- companies.goodguide.com
- compare-video-editing-software.burnworld.com
- compare.consumerbell.com
- compare.guns.com
- compare.roadcyclinguk.com
- comparemotorbikes.motorbike-search-engine.co.uk
- congressional-lookup.nationaljournal.com
- courses.golfdigest.com
- crm.venturebeat.com
- cyclocross-bikes.cyclingdirt.org
- dealers.gundigest.com
- death-record.com
- debt.humanevents.com
- design-software.underworldmagazines.com
- destination-finder.fishtrack.com
- diet-programs.shape.com
- digital-cameras.techcrunch.com
- dinosaurs.sciencedaily.com
- dirt-bikes.cycleworld.com
- dogbreeds.petmd.com
- dogs.petharbor.com
- donors.csmonitor.com
- e-readers.techcrunch.com
- earmarks.humanevents.com
- earthquakes.sciencedaily.com
- ehr-software.technewsworld.com
- fallacies.sciencedaily.com
- fec-candidates.theblaze.com
- fec-committees.theblaze.com
- federal-debt.nationaljournal.com
- fha-condos.realtor.org
- fha.nuwireinvestor.com
- financial-advisors.minyanville.com
- findthebest.com
- findthebest.motorcycleshows.com
- findthecoupons.com
- findthedata.com
- firms.privateequity.com
- franchises.fastfood.com
- ftb.cebotics.com
- game-consoles.tecca.com
- game-consoles.venturebeat.com
- gin.drinkhacker.com
- golf-courses.bunkershot.com
- gps-navigation.techcrunch.com
- gps-navigation.venturebeat.com
- green-cars.cleantechnica.com
- guns.dailycaller.com
- ham-radio.radiotower.com
- hdtv.techcrunch.com
- hdtv.venturebeat.com
- headphones.techcrunch.com
- headphones.venturebeat.com
- high-chairs.parenting.com
- highest-mountains.sciencedaily.com
- hiv-stats.realclearworld.com
- horsebreeds.petmd.com
- hospital-ratings.lifescript.com
- hr-jobs.findthelistings.com
- inventors.sciencedaily.com
- investment-advisors.minyanville.com
- investment-banks.minyanville.com
- iv-housing.dailynexus.com
- laptops.mobiletechreview.com
- laptops.techcrunch.com
- laptops.venturebeat.com
- lawschool.lawschoolexpert.com
- locategrave.org
- mammography-screening-centers.lifescript.com
- mba-programs.dealbreaker.com
- medigap-policies.findthedata.org
- military-branches.nationaljournal.com
- motorcycles.cycleworld.com
- mountain-bikes.outsideonline.com
- nannies.com
- nobel-prize-winners.sciencedaily.com
- nursing-homes.caregiverlist.com
- nursing-homes.silvercensus.com
- onlinecolleges.collegenews.com
- phones.androidauthority.com
- pickups.agriculture.com
- planets.realclearscience.com
- planets.sciencedaily.com
- plants.backyardgardener.com
- presidential-candidates.theblaze.com
- presidents.nationaljournal.com
- privateschools.parentinginformed.com
- processors.betanews.com
- project-management-software.venturebeat.com
- projectors.techcrunch.com
- pushcarts.golfdigest.com
- recovery-and-reinvestment-act.theblaze.com
- religions.theblaze.com
- reviews.creditcardadvice.com
- saving-accounts.bankingadvice.com
- sb-marinas.noozhawk.com
- sb-nonprofits.noozhawk.com
- scheduling-software.venturebeat.com
- scholarships.savingforcollege.com
- schools.nycprivateschoolsblog.com
- scooters.cycleworld.com
- smartphones.techcrunch.com
- smartphones.venturebeat.com
- solarpanels.motherearthnews.com
- sports-drinks.flotrack.org
- stables.thehorse.com
- state-economic-facts.nationaljournal.com
- steppers.shape.com
- strollers.parenting.com
- supplements.womenshealthmag.com
- tablets.androidauthority.com
- tablets.techcrunch.com
- tablets.venturebeat.com
- tabletsandstuff.com/tablet-comparison-chart
- tallest-buildings.sciencedaily.com
- technology.searchenginewatch.com
- telescopes.universetoday.com
- tequila.proof66.com
- texas-golf-courses.texasoutside.com
- tires.agriculture.com
- tractors.agriculture.com
- tsunamies.sciencedaily.com
- us-hurricanes.sciencedaily.com
- video-cameras.venturebeat.com
- volcanic-eruptions.com
- waterheaters.motherearthnews.com
- wetsuits.swellinfo.com
- whiskey.cocktailenthusiast.com
- whiskey.drinkoftheweek.com
- white-house-visitors.theblaze.com
- wineries.womenshealthmag.com
we have seen search results where a search engine didn't robots.txt something out, or somebody takes a cookie cutter affiliate feed, they just warm it up and slap it out, there is no value add, there is no original content there and they say search results or some comparison shopping sites don't put a lot of work into making it a useful site. They don't add value. - Matt Cutts
That syndication partnership network also explains part of how FTB is able to get so many pages indexed by Google, as each of those syndication sources is linking back at FTB on (what I believe to be) every single page of the subdomains, and many of these subdomains are linked to from sitewide sidebar or footer links on the PR7 & PR8 tech blogs.

And so the PageRank shall flow ;)
Hundreds of thousands of hours (eg 200,000+) for 40 people is 5,000 hours per person. Considering that there are an average of 2,000 hours per work year, this would imply each employee spent 2.5 full years of work on this single aspect of the job. And that is if one ignores the (hundreds of?) millions of content pages on other sites.
How does TechCrunch describe the FTB partnership?
Here’s one reason to be excited: In its own small way, it combats the recent flood of crappy infographics. Most TechCrunch writers hate the infographics that show up in our inboxes— not because infographics have to be terrible, but because they’re often created by firms that are biased, have little expertise in the subject of the infographic, or both, so they pull random data from random sources to make their point.
Get that folks? TechCrunch hosting automated subdomains of syndicated content means less bad infographics. And more cat lives saved. Or something like that.
How does FTB describe this opportunity for publishers?
The gadget comparisons we built for TechCrunch are sticky and interactive resources comprised of thousands of SEO optimized pages. They help over 1 million visitors per month make informed decisions by providing accurate, clear and useful data.
SEO optimized pages? Hmm.
Your comparisons will include thousands of long-tail keywords and question/answer pages to ensure traffic is driven by a number of different search queries. Our proprietary Data Content Platform uses a mesh linking structure that maximizes the amount of pages indexed by search engines. Each month—mainly through organic search—our comparisons add millions of unique visitors to our partner’s websites.
Thousands of long-tail keyord & QnA pages? Mesh linking structure? Hmm.
If we expand the "view more" section at the footer of the page, what do we find?
Holy Batman.
Sorry that font is so small, the text needed reduced multiple sizes in order to fit on my extra large monitor, and then reduced again to fit the width of our blog.
Each listing in a comparison has a number of associated questions created around the data we collect.
For example, we collect data on the battery life of the Apple iPad.
An algorithm creates the question “How long does the Apple iPad tablet battery last?” and answers it
So now we have bots asking themselves questions that they answer themselves & then stuffing that in the index as content?
Yeah, sounds like human-driven editorial.
After all, it's not like there are placeholder tokens on the auto-generated stuff
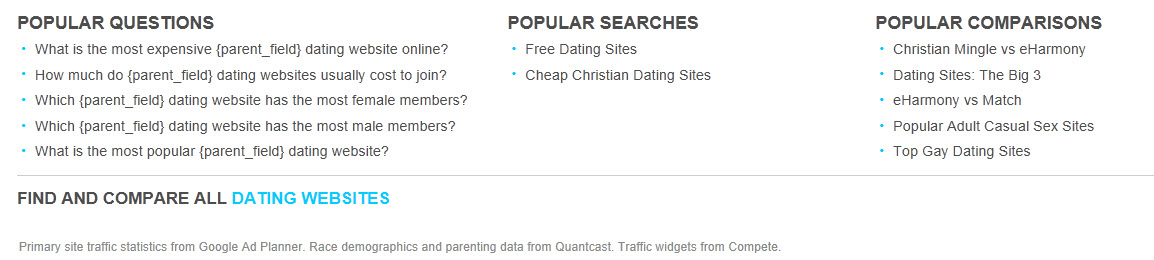
{parent_field}
Ooops.
Looks like I was wrong on that.
And automated "popular searches" pages? Nice!
As outrageous as the above is, they include undisclosed affiliate links in the content, and provided badge-based "awards" for things like the best casual dating sites, to help build links into their site.

That in turn led to them getting a bunch of porn backlinks.
If you submit an article to an article directory and someone else picks it up & posts it to a sketchy site you are a link spammer responsible for the actions of a third party.
But if you rate the best casual dating sites and get spammy porn links you are wonderful.
Content farming never really goes away. It only becomes more corporate.


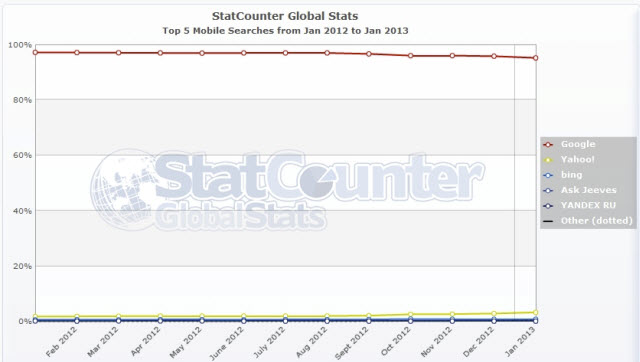
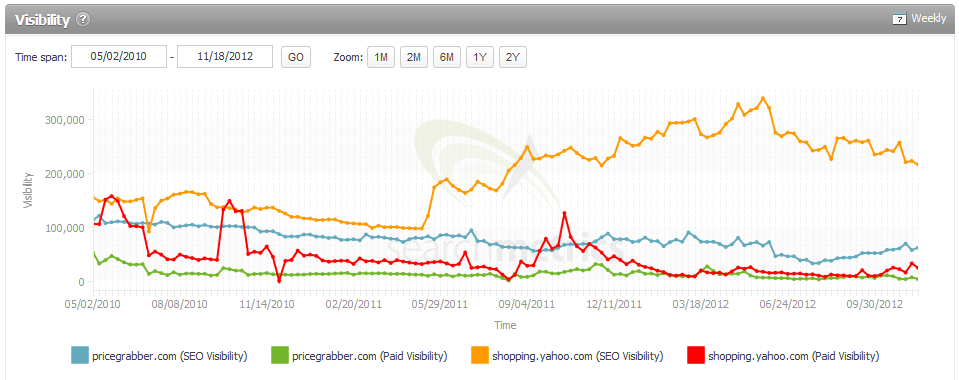
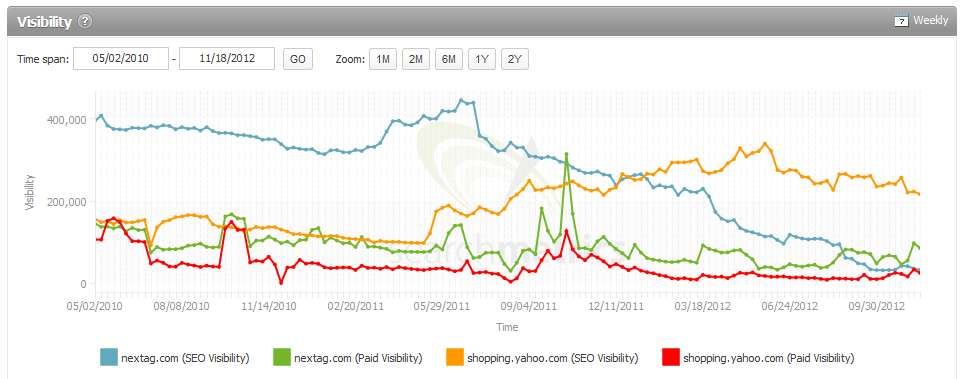
 In spite of losing share on browser defaults & mobile, Yahoo! managed to
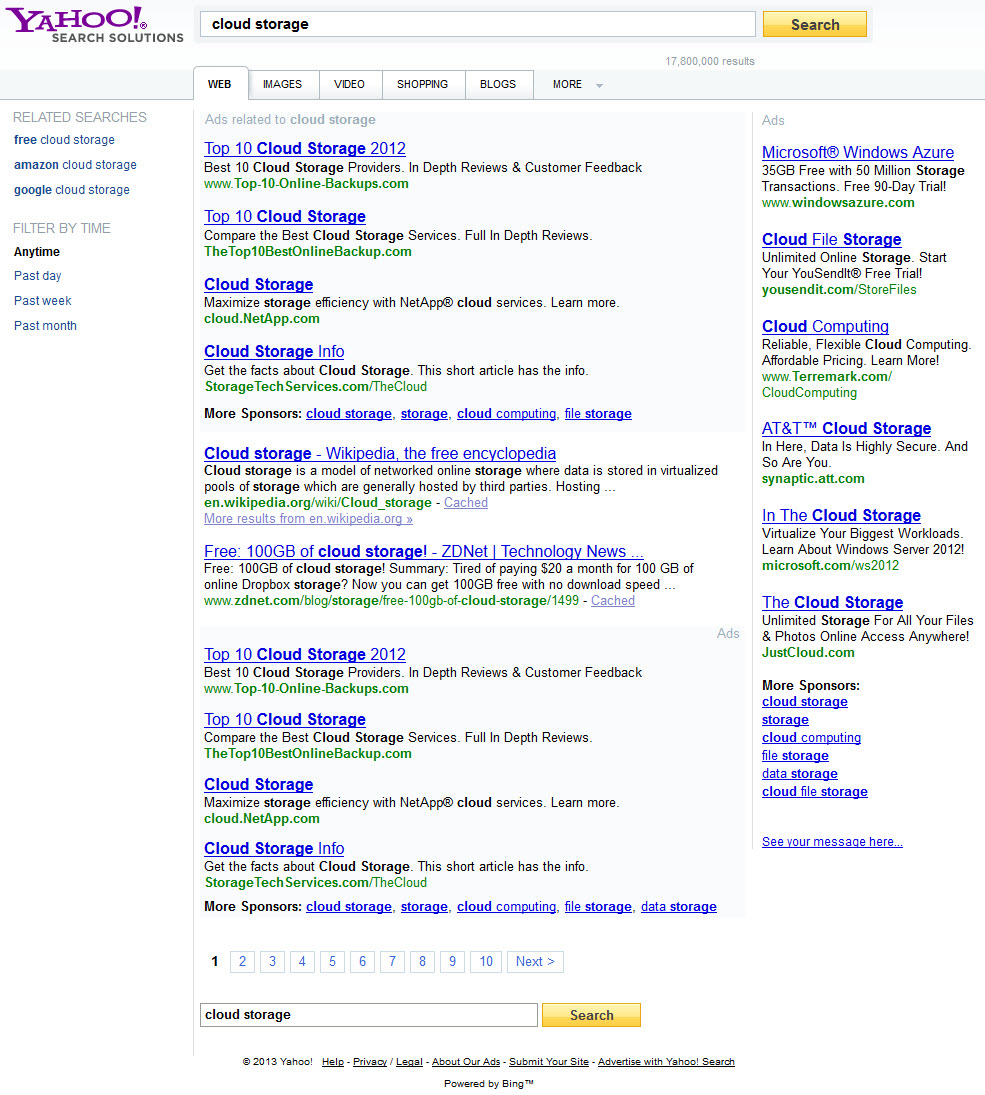


