Google AdWords Ads Add Album Cover & Song Preview

Before I get any drops of jupiter hate on the following...I was typing in training.seobook.com & somehow accidentally hit enter after typing train & when the URL completion didn't work I got the following SERP.

If you click the feature video link it does a YouTube video overlay. The other links lead into the relevant iTunes webpage.

Such media extensions have been in place for movies for quite a while now, but this is the first time I have seen them on music-related search results. In time one could expect similar ad expansions to hit other media areas like books, games, and maybe even other vertical search features. Google could possibly roll it out globally on brand searches as well at some point, allowing companies to offer intro videos (or even reviews of new product lines) directly in the search results.

The Google Penguin Update: Over-Optimization, Webspam, & High Quality Empty Content Pages

Huge Update

Google recently launched their webspam Penguin update. While they claim it only impacted about 3.1% of search queries, the 3.1% it impacted were largely in the "commercial transactional keywords worth a lot of money" category.

Based on the number of complaints online about it (there is even a petition!) this is likely every bit as large as Panda or the Florida update. A friend also mentioned that shortly after the update WickedFire & TrafficPlanet both had sluggish servers, yet another indication of the impact of the update.

Spam vs OOP

Originally leading up to the update, the update was sold as being about over-optimization. However when it was launched it was given no pet name, but rather given the name of the webspam update. Thus anyone who complained about the update was by definition a spammer.

A day after declaring that the name didn't have any name Google changed positions and called the update the Penguin update.

Why the quick turn around on the naming?

If you smoke a bunch of webmasters & then label them all as spammers, of course they are going to express outrage and look for the edge cases that make you look bad & promote those. One of the first ones out of the gate on that front was a literally blank blogspot blog that was ranking #1 for make money online.

As I joked with Eli, if it is blank then they couldn't have done anything wrong, right? :D

Another site that got nailed by the update was Viagra.com. It has since been fixed, but it is pretty hard for Google to state that the sites that got hit are spam, blend the search ads into the results so much that users can't tell them apart & force Pfizer to buy their own brand to rank. If that condition didn't get fixed quickly I am pretty certain it would lead to lawsuits.

Google also put out a form to collect feedback about the update. They only ever do that if they know they went too far and need to refine it. Or, put another way, if this was the Penguin update then this is GoogleBot:

So Worried About Manipulation That They Manipulate Themselves

When I was a kid I used to collect baseball cards. As the price of pictures from sites like iStockphoto have gone up I recently bought a few cards on eBay (in part for nostalgia & in part to have pictures for some of our blog posts). Yesterday I searched for baseball card holders for mini-cards & in the first page of search results was:

  • a big ecommerce site where the review on that product stated that the retail described the quantity as being 10x what you actually get (the same site had other better pages)
  • a user-driven aggregator site with a thin affiliate post made years ago & attributed to a site that no longer exists
  • a Facebook note that was auto-generated from a feed
  • an old blogspot splog
  • a broader tag page for a social site
  • a Yahoo! Shopping page that was completely empty


That blank Yahoo! Shopping page is also what showed up in Google's cache too. So I am not claiming that they were spamming Google in any way, rather that Google just has bad algorithms when they rank literally blank pages simply because they are on an authoritative domain name.

The SERPs lacked expert blogs, forum discussions, & niche retailers. In short, too much emphasis on domain authority yet again.

Part of the idea of the web was that it could connect supply and demand directly, but an excessive focus on domain authority leads users to have to go through another set of arbitragers. Efforts to squeeze out micro-parasites has led to the creation of macro-parasites (and micro-parasites that ride on the macro-parasite platforms).

SEO-based Business Models

Now more than ever SEO requires threading the needle: being sufficiently aggressive to see results, but not so aggressive that you get clipped for it (and hopefully building enough protection that makes it harder for others to clip you). That requires a tighter integration of the end to end process (tying efforts into analytics & analytics back into efforts) & a willing to view SEO through a broader marketing lens & throwing up a number of hail marry passes that likely won't on their own back out but will give you a lower risk profile when combined with your other stuff.

And your business model is probably far more important than your SEO skill level is. Imagine running a consulting company for a lot of small business customers for a few hundred Dollars a month each, based on stable rankings & then dealing with a tumultuous update that hits a number of them at the same time. And then they see an older (abandoned even) competing site of lower quality with fewer links ranking and they think you are selling them a bag of smoke. These sorts of updates harm the ability to do SEO consulting for anyone who isn't consulting the big brands. Yes many people made it through this update unscathed, but how many of these sorts of updates can one manage to slide through before eventually getting clipped?

The Unknowable Future

As search evolves, invariably anyone who is doing well in the ecosystem will at some point face setbacks. Those may happen due to an algorithm update or an interface change where Google inserts itself in your market. If you never get hit, it means you were only operating at a fraction of your potential. If you consistently get hit, you might be aiming too low. Many trends can be predicted, but the future is unknowable, so set up a safety cushion when things are going well.

This year Google has moved faster than any year in their history (massive link warnings, massive link penalties, tighter integration of Panda & now Penguin) & the rate of change is only accelerating. Go back about 125 years and a candle wick adjuster was cutting edge technology marketed as brand spanking new:

Blekko has a decently competitive search service which they manage to run for only a few million a year. As computers get cheaper & Google collects more data think of all the different data points they will be able to layer into their relevancy algorithms. In some markets Chrome has more marketshare than Internet Explorer does & Android is another deep data source. And they can know what user data to trust most by tracking things like if they have a credit card or phone verified on file & how often they use various services like Gmail or YouTube. Google+ is just icing on the cake.

At the same time, they need to improve. As the search algorithms get better, so do the business models that exploit them:

I asked Kristian Hammond what percentage of news would be written by computers in 15 years. “More than 90 percent.”

There will be many more casualties in that war.

GoogleBowling, Negative SEO & Outing

Excessive Complexity & Unintended Consequences

Sergey Brin recently said:

You have to play by their rules, which are really restrictive. The kind of environment that we developed Google in, the reason that we were able to develop a search engine, is the web was so open. Once you get too many rules, that will stifle innovation.

He was talking about Facebook, but those words are far more applicable to Google.

A Social Experiment

In the movie Dark Knight the Joker ran a social experiment where he offered 2 boats full of people the opportunity to save their own lives by blowing up the other boat. The boat full of "criminals" threw the button overboard & the other boat also decided not to push the button.

Of course taking someone's life is more extreme than taking their livelihood, but if you do the latter it might create stress and/or other issues which in effect lead to the former. Some people who see their income disappear might have a heart attack, others might have marriages that soon falls apart, leading into a spiral of depression and substance abuse & eventually suicide. Others still might have employees that get laid off & end up heading down some of the same scary paths - through no fault of their own.

Negative SEO Goes Mainstream

Anyone who outs or link bombs smaller businesses (small enough that Google punishing them destroys their livelihood rather than just giving them a bad quarter) is a _______. Anyone who advocates outing or link bombing such businesses is an even larger _______.

Why?

With all of Google's warning messages about abnormal links they have built the negative SEO industry in a big way. In some instances those who are not good enough to compete try to harm competitors. I received emails & support tickets like the following one for years and years...

...but the rate of demand increase for such "services" has been sharp this year. Every additional warning message from Google creates additional incremental demand.

And this is where outing a competitor makes one a total and complete _______ of a human being.

A Recent (& Very Public) Example of Negative SEO

Dan Thies mentioned that it was "about time" that Google started hitting some of the splog link networks.

Anyone who knows the tiniest bit about the social sciences could predict what came next.

In response to his Tweet, someone signed his site up for some splog links & Scrapebox action. Now he is getting warnings about his unnatural link profile. Dan didn't intentionally violate Google's guidelines, but he became a convenient target:

15th March - Dan Thies posts smug tweets to Matt Cutts and pisses off the entire internet.
18th March - seofaststart.com - blog posts started - anchor text "seo" "seo service" and "seo book"
22th March - seofaststart.com - 1 million scrapebox blast started - 100% anchor text "Dan Thies"
26th March - Dan Thies posts in Twitter that he has received an unnatural links message.

Since then Dan has installed a new template & his rankings tanked. Is it the template or the spam links? Probably the spam links, given how many other sites have got hit for using too much focused anchor text.

  • Will the site stay tanked? If so, now Google's approach to anchor text & link spikes allows independent websites to get torched in a few weeks for a few Dollars.
  • Or will the site come back stronger than ever with the help of the spam links? If it does, then how long is it before people start accidentally spam blasting their own websites & posting a public case study about burning a competitor on a forum, then citing that forum thread in their reconsideration request?
  • If the site quickly comes back, will that be due to a manual intervention by a search engineer, or from an algorithm more advanced than some people are giving it credit for being?

When asking such questions one quickly arrives at another set of questions. Is it the web that is broken? Or is it Google's editorial approach that is broken? If the observer breaks the system they observe, then the observer is the problem.

The Bigger Issue

The bigger issue isn't the short term trends for SEO related keywords or Dan's site (he will be fine & rankings are not that important for sites about SEO), but the big issue is that if this can happen to a decade old website then this can happen to literally anybody.

Piss off a ...

  • competitor
  • SEO
  • web designer
  • web developer
  • business partner
  • blogger
  • blog reader
  • former customer
  • freetard
  • ex-friend
  • bitter family member
  • insert any classification or category you like
  • etc.

... and risk getting torched.

When you out someone for shady links, you can't be certain they were responsible for it. They could have had a falling out with a consultant or business partner or another competitor who wanted to hose them. Or their SEO or webmaster could have been non-transparent with them.

Then you out them & they might be toast.

White Hat, Black Hat & ________ Hat SEO

Any of the ________ who promote competitor smoking or competitor outing as somehow being "ethical" or "white hat" never bother to explain what happens to YOU when someone else does that to you.

Sketchy marketers can make just about anything look good at first glance. No matter how shiny the package in concept, it is hard to appreciate the pain until you are the one undergoing it.

Building things up is typically far more profitable than tearing things down & if SEOs go after each other then the only winner is Google. Literally every other participant in the ecosystem has higher risk, higher costs & is taxed by the additional uncertainty. Sure some of the conscripts might get a bit of revenues and some of the "white hat" hacks might gain incremental short term exposure, but as the marrow is scraped out of the bone, they too will fall hard.

Google is betting that the SEO industry is full of ________. If our trade is to worth being in, I hope Google is wrong! If not, you will soon see most of the quality professionals in our trade go underground, while only the hacks who misinform people & are an unofficial extension of Google's public relations team remain publicly visible.

That might be Google's goal.

Will they be successful at it?

That depends entirely on how intelligent members of the SEO industry are.

Consumer Ad Awareness in Search Results

Consumer Search Insights.

For the following study, we asked "Does this search result have ads on it? " to 1,000 searchers, per search results. Due to these surveys requiring a smaller image (to fit the ad unit size) we chose search results that generally had more ads on them (typically 3 or 4) so that the background had a significant portion of real estate devoted to ads, in spite of its small size. The one exception here was DuckDuckGo, as it only displays one ad at most even on highly commercial keywords like credit cards.

Other than resizing the search result to fit, the only modifications we generally made were removing the graphic picture from the Wikipedia page near the top of the DuckDuckGo SERP (since a prior study showed that users presumed there was a correlation between graphics and the perception of ads) and that in most cases we removed the right sidebar. We did include the sidebar ads on 3 different Bing, Google, & Yahoo! search results so that we could compare the impact of sidebar ads vs not having a sidebar.

Executive Summary

The 3 big takeaways are:

  • For most search engines, people are generally unaware of ads vs organic results if there are no ads in the right column ... most of these yes/no questions came down to about a 50/50 vote, even though all of them had ads on them. It is every bit as true today as it was in 2003.
  • If there is a right column, the percent of people who voted that there are ads on the page jumps significantly. Thus it is pretty safe to say that people think ads are in the right column & that the right column is ads.
  • Interestingly, among major search engines, Yahoo! (without sidebar) got more "yes, it has ads" votes than other search engines. In fact, Yahoo! without sidebar ads scored within 1% of Bing with sidebar ads.

Combined Survey Results

For the question Does this search results have ads on it?

search engine yes no
AOL 53.1% (+3.9 / -3.9) 46.9% (+3.9 / -3.9)
Ask 52.0% (+4.0 / -4.1) 48.0% (+4.1 / -4.0)
Ask Arbitrage 51.6% (+3.9 / -3.9) 48.4% (+3.9 / -3.9)
Bing 50.2% (+3.8 / -3.8) 49.8% (+3.8 / -3.8)
Bing w Sidebar 57.7% (+3.7 / -3.8) 42.3% (+3.8 / -3.7)
Dogpile 44.7% (+4.1 / -4.0) 55.3% (+4.0 / -4.1)
Duck Duck Go 52.3% (+3.9 / -3.9) 47.7% (+3.9 / -3.9)
Google 54.5% (+4.0 / -4.0) 45.5% (+4.0 / -4.0)
Google w Sidebar 62.9% (+3.6 / -3.8) 37.1% (+3.8 / -3.6)
Yahoo! 56.8% (+3.9 / -4.0) 43.2% (+4.0 / -3.9)
Yahoo! w Sidebar 59.8% (+3.9 / -4.1) 40.2% (+4.1 / -3.9)

User Voting Images

Here are the images users saw when they voted:

AOL SERP

Ask SERP

Ask Arbitrage SERP

Bing SERP

Bing With Sidebar SERP

Dogpile SERP

DuckDuckGo SERP

Google SERP

Google With Sidebar SERP

Yahoo! SERP

Yahoo! With Sidebar SERP

Which SERP Has an Ad? (Maps vs AdWords Ads)

Prior to doing the above study, we asked users to please click on the search result which has an ad in it, listing search results side by side. Any bias presented in this (outside of both having smaller than actual sizes) impacts both images. At first we did a regular Google SERP where we included the branding & then we followed up with one that is more zoomed in on the actual search results but does not include branding. On the one that was less zoomed in people thought the map was an ad more often, but upon further zooming they thought it was roughly 50/50.

SERP All (1172) 
 Left 53.7% (+3.3 / -3.4)
 Right 46.3% (+3.4 / -3.3)

SERP All (1198) 
 Left 49.6% (+3.4 / -3.4)
 Right 50.4% (+3.4 / -3.4)

Comparing Google+ to Ads

Does this search result have ads on it?

layout yes no
Google+ without ads 56.3% (+3.1 / -3.1) 43.7% (+3.1 / -3.1)
Google+ with ads 56.9% (+3.2 / -3.2) 43.1% (+3.2 / -3.2)
large top ads w/o Google+ 53.6% (+3.2 / -3.2) 46.4% (+3.2 / -3.2)

Searchers tend to think that Google+ integration in the right rail is an ad unit. More people voted that Google+ without ads had ads in the search results than a SERP with 4 AdWords ad units and no Google+ integration.

Search Engine Ad Background Color

After seeing that users generally guessed no better than a coin toss at best in most cases, we decided to ask What background color do Google search results use to denote top left search advertisements? The same question was asked of Yahoo! & Bing search results.

Google
Google All (1147) 
none, they are white 49.7% (+3.2 / -3.2)
blue 25.5% (+3.0 / -2.8)
yellow 10.6% (+2.3 / -2.0)
pink 7.0% (+2.1 / -1.6)
purple 7.2% (+2.2 / -1.7)
Yahoo!
Yahoo! All (1080) 
none, they are white 44.6% (+3.4 / -3.4)
blue 20.9% (+3.0 / -2.7)
yellow 15.6% (+2.7 / -2.4)
magenta 11.2% (+2.5 / -2.1)
orange 7.7% (+2.3 / -1.8)
Bing
Bing All (1063) 
none, they are white 49.0% (+3.6 / -3.6)
blue 23.5% (+3.2 / -3.0)
yellow 13.0% (+2.8 / -2.4)
purple 7.5% (+2.4 / -1.9)
pink 7.1% (+2.4 / -1.8)
Summary

Bing scored highest, however blue also scored as the 2nd highest color for all 3 search engines. Nearly half of searchers believe that top ads have a white background, which highlights a general widespread lack of awareness of search ads.

Search Engine % Who Answered Correctly
Bing (blue) 23.5%
Yahoo! (magenta) 11.2%
Google (yellow) 10.6%

Ad Location on the SERP

Given how little awareness users have of ad background color, I decided to ask: Where might ads appear on search results at top search engines like Bing & Google?

Vote All (1144) 
right column 34.2% (+3.4 / -3.3)
all 3 locations 29.6% (+3.2 / -3.0)
search results do not carry ads 19.4% (+3.0 / -2.7)
top of the left column 9.2% (+2.5 / -2.0)
bottom of the left column 7.6% (+2.4 / -1.9)

Less than 3 in 10 answered the question correctly & nearly 20% of people do not think search results carry any ads, which explains how an algorithmic penalty can create a bad quarter, why Google was sued in Australia for misleading ads & why the Rosetta Stone vs Google case was overturned. Next time you hear a search engineer talk about clearly labeling paid links, ask them why they do such a poor job of it themselves!

User Trust in Ad Versus Organic Results

Ever since search engines have weeded out some of the more exploitative reverse billing fraud ads, trust in online ads has been growing. Based on the above, we wanted to see how users perceive ads vs organic search results, so I asked: Search engines include both algorithmic search results and ads in them. Which do you trust more?

Answer All (1168) 
I trust both equally 45.8% (+3.3 / -3.2)
Algorithmic search results 40.9% (+3.2 / -3.1)
Ads that appear in search results 13.3% (+2.5 / -2.2)

The above result surprised me given how people disliked money influencing search results. It is a strong compliment to the ads that only 40% of people trust the editorial more than the ads. However this number might be thrown off by the fact that many people are unaware of where the ads actually appear in the search results & what results are ads. (As noted above, most people voted that they thought that either search ads were only in the right column or that there weren't ads in the SERPs.)

Making Up for the Small Image Problem

One of the bigger issues with Google's current survey solution is that you are limited to rather small sized images. Such limitations do not harm asking a question like "what color does Google use for x" but they do make the search result a bit harder to see. To compensate for that problem we ran a separate survey on AYTM, where users were able to view a search result in full screen mode for 10 seconds & then they were asked 3 questions.

The purpose of the first question was to put a few seconds in between them seeing the image and them answering the second question. One other improvement that was made here (in addition to allowing users to see a larger sized search result image) was that we added an "I am not sure" answer to the questions. Below are the responses in table + graphic form, followed by the AYTM widget.

Where May Ads Appear on Google's Search Results Page?

Location Vote
in the right column 28.70%
top of the left column 6.20%
bottom of the left column 1.90%
middle of the left column 2.30%
search results do not have ads in them 6.80%
I am not sure 18.90%
right column & the top + bottom of the left column 35.20%

Did the Viewed Search Result Have Any Ads On It?

Answer Vote
I'm not sure 41.00%
no 12.40%
yes 46.60%

What Background Color Does Google Use to Denote Ads At the Top Left of Their Search Results?

Answer Vote
none, they are white 28.10%
blue 20.80%
purple 1%
I'm not sure 22.60%
pink 6.80%
yellow 20.70%

Even directly after viewing a search result with 3 ads in it, most users are uncertain of where ads may appear, what color the ads are, and if the search result even had any ads in it!

Users confusing the yellow background as white shortly after seeing it is anything but an accident:

In a RGB color space, hex #fef7e6 is composed of 99.6% red, 96.9% green and 90.2% blue. Whereas in a CMYK color space, it is composed of 0% cyan, 2.8% magenta, 9.4% yellow and 0.4% black. It has a hue angle of 42.5 degrees, a saturation of 92.3% and a lightness of 94.9%. #fef7e6 color hex could be obtained by blending #ffffff with #fdefcd. .

If you have an older monitor or a laptop which you are viewing at an angle these colors are nearly impossible to see.

Embed The AYTM Graph in Your Website

Here is the AYTM widget of the above 1,000 person survey, which you can embed in your website.

Embed Code:

Which Source Do You Trust Most?

Consumer Search Insights.

Which do you trust most as a source of advice on important issues?

People tend to trust friends & family and the mainstream media far more than they trust websites & search engines.

Vote All (1204) 
friends & family 37.1% (+3.0 / -2.9)
newspapers 32.5% (+3.0 / -2.8)
search engines 19.3% (+2.6 / -2.4)
social media websites 6.7% (+2.0 / -1.6)
weblogs 4.4% (+1.9 / -1.3)

Relative to one another, men tend to trust newspapers, search engines & weblogs more; whereas women tend to trust friends & family and social media websites more.

Vote Men (643)  Women (561) 
friends & family 34.7% (+4.0 / -3.8) 39.4% (+4.6 / -4.4)
newspapers 34.1% (+4.0 / -3.8) 31.0% (+4.4 / -4.1)
search engines 20.1% (+3.5 / -3.1) 18.6% (+3.9 / -3.4)
social media websites 5.7% (+2.5 / -1.8) 7.6% (+3.3 / -2.3)
weblogs 5.5% (+2.5 / -1.8) 3.4% (+3.3 / -1.7)

The youngest age group tends to trust social media a bit more & newspapers a bit less than other age groups do. Outside of that, it is somewhat hard to see other age-based patterns.

Vote 18-24 year-olds (278)  25-34 year-olds (307)  35-44 year-olds (158)  45-54 year-olds (191)  55-64 year-olds (166)  65+ year-olds (104) 
friends & family 39.8% (+5.8 / -5.5) 34.2% (+5.8 / -5.4) 38.9% (+7.8 / -7.2) 34.0% (+6.9 / -6.3) 36.3% (+7.6 / -6.9) 37.2% (+9.8 / -8.8)
newspapers 26.2% (+5.5 / -4.8) 35.8% (+5.9 / -5.5) 33.9% (+7.7 / -6.9) 31.7% (+6.8 / -6.1) 33.1% (+7.6 / -6.8) 34.6% (+10.0 / -8.8)
search engines 19.7% (+5.1 / -4.2) 16.8% (+4.9 / -4.0) 17.7% (+6.7 / -5.2) 23.5% (+6.5 / -5.5) 21.8% (+7.1 / -5.7) 17.7% (+8.5 / -6.2)
social media websites 11.0% (+4.2 / -3.1) 6.8% (+3.6 / -2.4) 3.6% (+5.1 / -2.1) 7.4% (+4.6 / -2.9) 4.3% (+4.5 / -2.3) 6.6% (+8.0 / -3.8)
weblogs 3.3% (+2.8 / -1.5) 6.4% (+3.5 / -2.3) 6.0% (+5.1 / -2.9) 3.4% (+4.1 / -1.9) 4.4% (+5.3 / -2.5) 3.9% (+7.4 / -2.6)

Here is data by geographic region.

Vote The US Midwest (252)  The US Northeast (311)  The US South (372)  The US West (269) 
friends & family 40.2% (+6.9 / -6.6) 39.0% (+6.2 / -5.9) 34.9% (+5.3 / -5.0) 36.1% (+6.2 / -5.8)
newspapers 30.4% (+6.8 / -6.1) 36.0% (+6.1 / -5.7) 33.7% (+5.2 / -4.9) 29.9% (+6.1 / -5.5)
search engines 21.5% (+6.4 / -5.3) 15.7% (+5.2 / -4.1) 18.7% (+4.6 / -3.9) 21.2% (+5.5 / -4.6)
social media websites 6.7% (+5.1 / -3.0) 5.2% (+4.3 / -2.4) 6.6% (+3.8 / -2.5) 7.9% (+4.5 / -3.0)
weblogs 1.3% (+9.5 / -1.1) 4.1% (+4.3 / -2.1) 6.2% (+3.6 / -2.3) 4.8% (+4.3 / -2.3)

Rural people tend to trust friends & family more, while urban people tend to trust newspapers more.

Vote Urban areas (602)  Rural areas (91)  Suburban areas (480) 
friends & family 30.9% (+4.4 / -4.0) 45.8% (+11.3 / -10.9) 38.7% (+4.9 / -4.7)
newspapers 38.5% (+4.7 / -4.5) 25.4% (+11.3 / -8.7) 30.0% (+4.5 / -4.2)
search engines 18.4% (+4.2 / -3.6) 20.2% (+10.4 / -7.5) 20.2% (+4.3 / -3.7)
social media websites 8.5% (+4.1 / -2.8) 2.3% (+14.6 / -2.1) 6.2% (+4.3 / -2.6)
weblogs 3.7% (+4.2 / -2.0) 6.3% (+11.2 / -4.2) 4.8% (+4.3 / -2.3)

The richer you are, the less you generally trust friends & family. The rich also trust newspapers & blogs more (though the blog data point had a small sample size).

Vote People earning $0-24K (138)  People earning $25-49K (655)  People earning $50-74K (307)  People earning $75-99K (81)  People earning $100-149K (25) 
friends & family 40.6% (+8.7 / -8.2) 38.2% (+4.1 / -4.0) 33.9% (+6.3 / -5.8) 36.6% (+11.1 / -9.8) 14.4% (+19.1 / -9.1)
newspapers 25.6% (+9.1 / -7.4) 30.6% (+4.0 / -3.7) 37.0% (+6.4 / -6.0) 42.2% (+10.6 / -10.0) 42.2% (+20.3 / -18.0)
search engines 22.8% (+9.1 / -7.1) 20.6% (+3.7 / -3.3) 17.4% (+5.7 / -4.5) 13.4% (+10.9 / -6.4) 22.0% (+21.5 / -12.7)
social media websites 7.2% (+9.2 / -4.2) 7.0% (+3.2 / -2.3) 5.4% (+5.6 / -2.8) 5.2% (+13.2 / -3.9) 5.8% (+23.7 / -4.9)
weblogs 3.8% (+11.0 / -2.9) 3.6% (+3.5 / -1.8) 6.3% (+5.4 / -3.0) 2.6% (+18.2 / -2.3) 15.6% (+21.7 / -10.2)

How Did You Choose Your Primary Search Engine?

Consumer Search Insights.

When you search, how did you pick your primary search engine?

Most people use the search engine which they believe has the best relevancy, whatever their computer came with, or what a friend recommended.

Vote All (1190) 
it has superior relevancy 30.4% (+3.0 / -2.9)
the computer had a default selected 26.8% (+2.9 / -2.7)
a friend told me about it 23.1% (+2.9 / -2.7)
I saw it on a TV ad 10.3% (+2.3 / -1.9)
it came bundled with software 9.5% (+2.3 / -1.9)

Men are more inclined to believe in superior relevancy, whereas women are more likely to use the default or what a friend recommends

Vote Men (621)  Women (569) 
it has superior relevancy 35.4% (+4.2 / -3.9) 25.5% (+4.4 / -4.0)
the computer had a default selected 21.8% (+3.7 / -3.3) 31.5% (+4.6 / -4.3)
a friend told me about it 21.3% (+3.7 / -3.3) 24.8% (+4.5 / -4.0)
I saw it on a TV ad 11.9% (+3.1 / -2.5) 8.8% (+3.5 / -2.6)
it came bundled with software 9.7% (+2.9 / -2.3) 9.3% (+3.8 / -2.8)

The youngest age group is easiest to influence with advertising or buying the default placement. 25 to 34 is more concerned about relevancy & older people are more likely to have it bundled with software than younger people are.

Vote 18-24 year-olds (289)  25-34 year-olds (309)  35-44 year-olds (151)  45-54 year-olds (186)  55-64 year-olds (167)  65+ year-olds (88) 
it has superior relevancy 30.1% (+5.5 / -5.0) 36.9% (+5.9 / -5.5) 32.4% (+7.8 / -6.9) 28.2% (+7.0 / -6.1) 27.6% (+7.7 / -6.6) 28.0% (+10.8 / -8.7)
the computer had a default selected 29.0% (+5.5 / -4.9) 23.8% (+5.4 / -4.7) 27.6% (+7.6 / -6.5) 24.2% (+6.8 / -5.7) 26.0% (+7.6 / -6.4) 26.1% (+11.3 / -8.8)
a friend told me about it 20.7% (+5.0 / -4.3) 21.1% (+5.5 / -4.6) 23.8% (+7.7 / -6.3) 24.8% (+7.0 / -5.9) 25.0% (+7.4 / -6.2) 24.6% (+11.4 / -8.7)
I saw it on a TV ad 14.2% (+4.5 / -3.6) 10.8% (+4.2 / -3.1) 10.5% (+6.0 / -4.0) 12.8% (+5.7 / -4.1) 8.3% (+5.5 / -3.4) 3.1% (+10.7 / -2.5)
it came bundled with software 6.0% (+3.4 / -2.2) 7.5% (+3.9 / -2.6) 5.8% (+5.4 / -2.9) 10.0% (+5.3 / -3.6) 13.1% (+5.8 / -4.2) 18.2% (+10.6 / -7.3)

People out west tend to be more concerned with / driven by perceived relevancy. People in the midwest rely more on word of mouth. People in the south and north east are more likely to use the default.

Vote The US Midwest (236)  The US Northeast (317)  The US South (369)  The US West (268) 
it has superior relevancy 24.4% (+6.8 / -5.7) 29.8% (+5.9 / -5.3) 29.6% (+5.3 / -4.8) 37.2% (+6.6 / -6.2)
the computer had a default selected 27.3% (+6.7 / -5.8) 29.3% (+6.0 / -5.3) 29.8% (+5.5 / -5.0) 19.8% (+5.6 / -4.7)
a friend told me about it 25.6% (+6.9 / -5.9) 18.4% (+5.4 / -4.4) 22.6% (+5.3 / -4.5) 25.0% (+6.1 / -5.3)
I saw it on a TV ad 11.5% (+5.8 / -4.0) 12.6% (+4.6 / -3.5) 9.8% (+4.4 / -3.1) 8.2% (+4.6 / -3.0)
it came bundled with software 11.2% (+6.1 / -4.1) 9.9% (+4.5 / -3.2) 8.1% (+4.3 / -2.9) 9.7% (+5.1 / -3.5)

Here is data by population density.

Vote Urban areas (612)  Rural areas (107)  Suburban areas (445) 
it has superior relevancy 29.9% (+4.2 / -3.9) 27.8% (+9.9 / -8.1) 30.4% (+5.3 / -4.8)
the computer had a default selected 27.2% (+4.4 / -4.0) 27.7% (+9.5 / -7.9) 26.5% (+5.1 / -4.5)
a friend told me about it 23.1% (+4.3 / -3.8) 25.1% (+9.6 / -7.6) 23.2% (+4.8 / -4.2)
I saw it on a TV ad 10.4% (+3.8 / -2.9) 8.7% (+8.6 / -4.5) 10.5% (+4.6 / -3.3)
it came bundled with software 9.4% (+4.0 / -2.9) 10.6% (+8.8 / -5.1) 9.3% (+4.5 / -3.1)

There doesn't appear to be any obvious correlations with age.

Vote People earning $0-24K (133)  People earning $25-49K (658)  People earning $50-74K (315)  People earning $75-99K (68)  People earning $100-149K (18) 
it has superior relevancy 32.8% (+9.1 / -7.9) 29.8% (+4.2 / -3.9) 30.9% (+6.5 / -5.8) 27.7% (+11.9 / -9.4) 32.6% (+21.2 / -15.9)
the computer had a default selected 21.7% (+8.6 / -6.7) 29.0% (+4.3 / -4.0) 22.1% (+6.0 / -5.0) 30.7% (+12.4 / -10.1) 20.9% (+22.5 / -12.6)
a friend told me about it 23.5% (+9.0 / -7.1) 24.5% (+4.1 / -3.7) 20.1% (+6.0 / -4.9) 17.2% (+12.0 / -7.7) 13.9% (+23.4 / -9.7)
I saw it on a TV ad 11.8% (+7.3 / -4.7) 8.4% (+3.5 / -2.5) 15.6% (+6.0 / -4.5) 4.2% (+13.7 / -3.3) 25.6% (+22.1 / -14.1)
it came bundled with software 10.2% (+7.7 / -4.6) 8.3% (+3.3 / -2.4) 11.4% (+5.5 / -3.9) 20.2% (+12.2 / -8.4) 7.0% (+27.3 / -5.9)

How Many Search Engines?

Consumer Search Insights.

How many search engines do you typically use in a given month?

Most people only use 1 or 2 search engines in any given month.

Vote All (1223) 
1 48.9% (+3.1 / -3.1)
2 26.2% (+2.9 / -2.7)
3 9.1% (+2.2 / -1.8)
4 4.7% (+2.0 / -1.4)
5 or more 11.1% (+2.3 / -2.0)

There isn't much difference between men & women on this front.

Vote Men (669)  Women (554) 
1 49.4% (+4.0 / -4.0) 48.4% (+4.8 / -4.8)
2 25.5% (+3.6 / -3.3) 26.9% (+4.6 / -4.1)
5 or more 10.6% (+2.9 / -2.3) 11.7% (+3.8 / -3.0)
3 9.7% (+2.8 / -2.2) 8.5% (+3.6 / -2.6)
4 4.8% (+2.5 / -1.7) 4.5% (+3.6 / -2.0)

Surprisingly, older people are more likely to use a variety of search services while younger people are more likely to stick with their one favorite. I would have guessed that to be the other way around.

Vote 18-24 year-olds (295)  25-34 year-olds (300)  35-44 year-olds (165)  45-54 year-olds (204)  55-64 year-olds (182)  65+ year-olds (77) 
1 54.9% (+5.5 / -5.7) 57.7% (+5.7 / -6.0) 45.6% (+7.7 / -7.5) 50.4% (+6.9 / -6.9) 48.1% (+7.3 / -7.3) 35.8% (+11.5 / -10.1)
2 23.0% (+5.1 / -4.4) 23.0% (+5.4 / -4.6) 23.1% (+7.1 / -5.8) 22.5% (+6.3 / -5.3) 29.2% (+7.1 / -6.2) 36.8% (+11.3 / -10.1)
3 5.8% (+3.3 / -2.1) 5.5% (+3.4 / -2.2) 13.7% (+6.0 / -4.4) 10.5% (+5.0 / -3.5) 11.5% (+5.5 / -3.9) 7.0% (+8.0 / -3.9)
4 6.8% (+3.5 / -2.4) 4.7% (+3.3 / -2.0) 4.2% (+4.7 / -2.3) 4.9% (+4.3 / -2.3) 2.1% (+3.8 / -1.4) 5.4% (+9.1 / -3.5)
5 or more 9.6% (+3.9 / -2.8) 9.1% (+3.9 / -2.8) 13.4% (+6.2 / -4.4) 11.7% (+5.3 / -3.8) 9.0% (+5.2 / -3.4) 15.0% (+9.7 / -6.3)

Here is the geographic breakdown.

Vote The US Midwest (260)  The US Northeast (320)  The US South (374)  The US West (269) 
1 53.6% (+6.5 / -6.6) 45.1% (+6.1 / -6.0) 47.0% (+5.8 / -5.7) 50.4% (+6.4 / -6.4)
2 22.7% (+6.2 / -5.2) 27.1% (+5.7 / -5.1) 26.8% (+5.5 / -4.8) 27.9% (+6.1 / -5.4)
3 8.7% (+4.9 / -3.2) 11.4% (+4.8 / -3.5) 8.6% (+4.4 / -3.0) 8.2% (+4.8 / -3.1)
4 3.5% (+5.2 / -2.1) 5.3% (+4.3 / -2.4) 5.7% (+4.1 / -2.5) 3.8% (+5.4 / -2.3)
5 or more 11.5% (+5.5 / -3.9) 11.1% (+4.7 / -3.5) 11.9% (+4.5 / -3.4) 9.7% (+5.2 / -3.5)

Here are stats by population density.

Vote Urban areas (608)  Rural areas (107)  Suburban areas (499) 
1 48.1% (+4.5 / -4.5) 50.2% (+9.8 / -9.8) 47.2% (+4.7 / -4.7)
2 26.4% (+4.1 / -3.8) 21.2% (+10.6 / -7.8) 27.8% (+4.5 / -4.1)
3 9.1% (+3.6 / -2.7) 14.2% (+10.7 / -6.6) 9.6% (+4.0 / -2.9)
4 5.3% (+4.0 / -2.3) 6.5% (+12.0 / -4.4) 3.8% (+4.4 / -2.1)
5 or more 11.0% (+3.8 / -2.9) 7.9% (+11.4 / -4.9) 11.6% (+4.2 / -3.2)

Here is data by income groups. No obvious pattern here either.

Vote People earning $0-24K (132)  People earning $25-49K (673)  People earning $50-74K (326)  People earning $75-99K (70)  People earning $100-149K (27) 
1 45.0% (+8.9 / -8.6) 47.7% (+4.2 / -4.2) 50.2% (+6.1 / -6.1) 42.1% (+12.3 / -11.4) 48.3% (+17.9 / -17.5)
2 29.1% (+9.0 / -7.6) 26.3% (+3.8 / -3.5) 23.1% (+6.2 / -5.3) 35.2% (+12.2 / -10.5) 37.4% (+18.8 / -15.6)
3 8.7% (+9.1 / -4.7) 8.6% (+3.2 / -2.4) 11.6% (+5.8 / -4.0) 9.7% (+11.7 / -5.6) 0.0% (+12.5 / -0.0)
4 6.1% (+9.5 / -3.9) 5.2% (+3.2 / -2.0) 4.3% (+6.3 / -2.6) 2.6% (+17.0 / -2.3) 3.4% (+22.2 / -3.0)
5 or more 11.0% (+8.9 / -5.2) 12.1% (+3.3 / -2.7) 10.9% (+5.8 / -3.9) 10.4% (+11.9 / -5.9) 10.9% (+16.7 / -7.1)

Search Again or Click On the Second Page of Search Results?

Consumer Search Insights.

If you use a search engine but don't find what you are looking for, which are you more likely to do?

People are more likely to search again with a new keyword than they are to click onto the second page of search results.

Vote All (1189) 
search again with a different word 55.7% (+3.2 / -3.3)
go to the second page of the results 44.3% (+3.3 / -3.2)

The split is fairly consistent among men and women.

Vote Men (651)  Women (538) 
search again with a different word 55.4% (+4.0 / -4.1) 56.1% (+5.0 / -5.1)
go to the second page of the results 44.6% (+4.1 / -4.0) 43.9% (+5.1 / -5.0)

There isn't an obvious pattern among age either.

Vote 18-24 year-olds (284)  25-34 year-olds (309)  35-44 year-olds (144)  45-54 year-olds (195)  55-64 year-olds (150)  65+ year-olds (107) 
search again with a different word 52.1% (+5.7 / -5.8) 56.7% (+5.7 / -5.9) 51.7% (+8.0 / -8.1) 57.5% (+6.7 / -7.0) 61.4% (+7.7 / -8.4) 54.2% (+9.4 / -9.8)
go to the second page of the results 47.9% (+5.8 / -5.7) 43.3% (+5.9 / -5.7) 48.3% (+8.1 / -8.0) 42.5% (+7.0 / -6.7) 38.6% (+8.4 / -7.7) 45.8% (+9.8 / -9.4)

People in the west & midwest are more likely to change keywords, whereas people in the north east & south are roughly equally likely to change keywords or go to page 2 of the search results.

Vote The US Midwest (244)  The US Northeast (320)  The US South (363)  The US West (262) 
search again with a different word 58.6% (+6.6 / -6.9) 52.2% (+6.3 / -6.4) 51.7% (+6.0 / -6.1) 61.8% (+6.2 / -6.6)
go to the second page of the results 41.4% (+6.9 / -6.6) 47.8% (+6.4 / -6.3) 48.3% (+6.1 / -6.0) 38.2% (+6.6 / -6.2)

Suburban people are more likely to change keywords than to click on to page 2.

Vote Urban areas (590)  Rural areas (109)  Suburban areas (468) 
search again with a different word 51.8% (+4.6 / -4.6) 48.0% (+9.3 / -9.1) 61.1% (+4.8 / -5.0)
go to the second page of the results 48.2% (+4.6 / -4.6) 52.0% (+9.1 / -9.3) 38.9% (+5.0 / -4.8)

There isn't much of an income correlation either.

Vote People earning $0-24K (123)  People earning $25-49K (638)  People earning $50-74K (319)  People earning $75-99K (88)  People earning $100-149K (22) 
search again with a different word 57.9% (+9.3 / -9.9) 55.9% (+4.4 / -4.5) 58.8% (+5.8 / -6.1) 54.5% (+9.3 / -9.6) 50.0% (+21.4 / -21.4)
go to the second page of the results 42.1% (+9.9 / -9.3) 44.1% (+4.5 / -4.4) 41.2% (+6.1 / -5.8) 45.5% (+9.6 / -9.3) 50.0% (+21.4 / -21.4)

It would also be interesting to run this question again & include the option of trying another search engine as an answer.

Citation Labs Review - Here's Why I Use it

So what are we calling it today? Link building, link prospecting, content marketing, linkbait, socialbait, PR ? Whatever it is and whatever sub-definitions exist for the process of finding quality, related websites to link back to yours is difficult and time-consuming work.

As with most processes associated with SEO campaigns, or website marketing campaigns in general, enterprising folks have built tools to make our lives a little easier and our time more fruitful and productive. A couple of those enterprising fellows are Garrett French and Darren Shaw (from Whitespark.Ca) over at Citation Labs.

Garrett has a suite of link building tools available, many of them complement his flagship tool; The Link Prospector.

Link Prospector Review TOC

To help you navigate to specific sections of the review we've included in-content links below.

Getting Started

Back to Topics

So let's assume I've been contracted to embark on a link building campaign for SeoBook :) It's very easy to create a campaign and get up and running:

Create your campaign:

clabs-1

Move right into the prospects section:

clabs-2

Start prospecting :)

clabs-3

Selecting a Report

Back to Topics

The nice thing about this tool is that it's designed for a specific purpose; link prospecting. It's not bloated with a bunch of other stuff you may not need and it's easy to use, yet powerful, because it focus on doing one thing and doing it very well.

The UI of this tool is right on the money, in my opinion. Garrett has built in his own queries to find specific types of links for you (preset Reports). Here you can see the reports available to you, which are built to help you find common link types:

clabs-4

Customizing Your Prospecting

Back to Topics

As you can see, there are a variety of built in queries available which run the gamut of most of the link outreach goals you might have (interviews, resource pages, guest posts, directories, and so on). Once you settle on the report type it's time to select additional parameters like:

  • Region
  • Web or Blog, or Web AND Blog results
  • Search Depth (You can go up to 1,000 deep here, but if you make use of your exclusion lists you shouldn't have to dive that deep)
  • TLD Options
  • Date Range (Google's "past our, day, week, month, year, or anytime" options)

Try to make your queries as relevant but broad as possible to get the best results. Searches that are too specific will either net to few results or many of your direct competitors. Here, you can see my report parameters for interviews I may want to do in specific areas of SEO (Garrett includes a helpful video on that page, which I highly recommend watching):

clabs-5

Using Exclusions

The use of exclusions is an often overlooked feature of this toolset. Brands are all over the SERPs these days so when you have the Link Prospector go out to crawl potential link sources based on keywords/queries, you'll want to make sure you exclude sites you are fairly certain you won't get a link from.

You may want to exclude such sites as Ebay, Amazon, NewEgg, and so on if you are running a site about computer parts. You can put your exclusions into 2 categories:

  • Global Exclusions
  • Campaign Exclusions

Global exclusions apply to each campaign automatically. You might want to go out and download top 100 site lists (or top 1,000) lists to stick in the Global Exclusions area or simply apply specific sites you know are irrelevant to your prospecting on the whole. To access Exclusion lists, just click on the exclusion option. From there, it's just a matter of entering your domains:

clabs-6

Campaign exclusions only apply to a specific campaign. This is good news if you provide link building services and work with a variety of clients; you are not constrained to one draconian exclusion list. In speaking with Garrett, he does mention that this is an often overlooked feature of the toolset but one of the most effective features (both Global and Campaign exclusions).

Working With the Data

Back to Topics

So I ran my report which was designed to find interviewees within certain broader areas of the SEO landscape. The tool will confirm submission of your request and email you when it's complete, at any time you can go in and check the status of your reports by going to Prospects -> View Prospects. Here's what the queue looks like:

clabs-7

The results are presented in a web interface but can be easily exported to excel. From the web interface, you can see:

  • Total Domains
  • Total Paths (pages on the domain where relevancy exists, maybe we would find a relevant video channel on YouTube where it makes sense to reach out)
  • TLD
  • LTS - Link Target Score
  • PR of Domain
  • Export Options

LTS is a proprietary score provided by Citation Labs (essentially a measure of domain frequency and position within the SERPs pulled back for a given report).

If we expand the domain to see the paths, using Search Engine Land as an example, we can see pages where targets outside of the main domain might exist for our interviewing needs:

clabs-9

This is where Citation Labs really shines. Rather than just spitting back a bunch of domains for you to pursue at a broad level, it breaks down authoritative domains into specific prospecting opportunities which are super-relevant to your query/keyword relationship.

If you are on Windows (or run Windows via a virutal machine) you can use SEO Tools for Excel to take all these URLs, or the ones you want to target, and pull in social metrics, backlink data, and many other data points to further refine your list.

You can also import this data right into Buzzstream (export from Citation Labs to a CSV or Excel, then import into Buzzstream) and Buzzstream will go off and look up relevant social and contact details for outreach purposes.

We recently did a Buzzstream Review that you might find helpful.

You can also utilize Garrett's Contact Finder for contact research.

Creating Your Own Queries

Back to Topics

Another nice thing about Citation Labs's Link Prospector is that you can enter your own query parameters. You are not locked in to any specific type of data output (even though the built in ones are solid). You can do this by selecting "Custom" in the report selection field

In the Custom Report area you can create your own search operators along with the following options:

  • Region
  • Web or Blog, or Web AND Blog results
  • Search Depth (You can go up to 1,000 deep here, but if you make use of your exclusion lists you shouldn't have to dive that deep)
  • TLD Options
  • Date Range (Google's "past our, day, week, month, year, or anytime" options)

One of the tools we mention quite a bit inside the forums is the Solo SEO Link Search Tool. You can grab a lot of search operators from that tool for your own use inside the Citation Labs tool.

Garrett's Pro Tips

Back to Topics

Can you give us some tips on using the right phrases?

One objection I hear from folks who test the link prospector is "my results are full of competitors." This is typically because the research phrases they've selected don't line up with the type of prospects they're seeking. And more often than not it's because they've added their target SEO keywords rather than "category keywords" that define their area of practice.

The solution is simple though - you just need to experiment with some "bigger head" phrases. Instead of using "Atlanta Divorce Lawyer" for guest post prospecting, try just "Divorce Lawyer," or even "Divorce."

And I'd definitely recommend experimenting with the tilde "~Divorce" as it will help with synonyms that you may not have thought of. So if you're looking for guest posting opportunities for a divorce lawyer your five research phrases could look like this:

divorce
~divorce
~divorce -divorce
Divorce ~Lawyer
"family law"

The link prospector tool will take these five phrases and combine them with 20+ guest posting footprints so we end up doing 100+ queries for you. And there WILL be domain repetitions due to the close semantic clustering of these phrases. This overlap can help "float up" the best opportunities based on our LTS score (which is essentially a measurement of relevance).

All this said there are PLENTY of situations where using your SEO keywords can be productive... For example in guest posting it's common for people to use competitive keywords as anchor text. You could (and yes I'm completely contradicting my example) use "Atlanta Divorce Lawyer" as a guest posting research phrase along with your other target SEO KWs. The prospects that come back will probably have been placed by competitors.

How do you fine-tune your research phrases?

I often test my research phrases before throwing them in the tool. Let's go back to the divorce guest posting example above. To test I simply head to Google and search [divorce "guest post"]. If I see 4 or more results in the top 10 that look like "maybes" I consider that a good keyword to run with. The test footprint you should use will vary from report-type to report-type.

A good links page test is to take a potential research phrase and add intitle:links. For content promoters you could combine a potential research phrase with intitle:"round up".

I find that this testing does two things. For one it helps me drop research phrases that are only going to clog my reports with junk.

Secondarily I often discover new phrases that are likely to be productive. Look back at the list of divorce research phrases above - the last one, "family law," is there because I spotted it while testing [~divorce "guest post"]. Spending time in Google is always, always productive and I highly advise it.

What tips can you give us regarding proper Search Depth usage?

Depth is a measure of how many results the link prospector brings back from Google. How often do you find useful results on the third page of Google? How about the tenth page? There's a gem now and again, but I find that if I've carefully selected 5 awesome research phrases I save time by just analyzing the results in the top 20.

Your mileage may vary, and the tool DOES enable users to scrape all the way down to 1000 for those rare cases where you have discovered a mega-productive footprint. Test it once for sure, don't just take my word for it - my guess is you'll end up with tons of junk that actually kills the efficiency that the tool creates.

Any more expert tips on how to best use phrases and search operators?

You can addadvanced search operators in all your research phrases. Combine them with your research phrases and try them out in Google first (see tip 2) and then use them as you see fit. I use the heck out of the tilde now, as it saves me time and aids in research phrase discovery when I vet my phrases in Google. The tilde even works in conjunction with the wildcard operator (*).

So if you're looking for law links pages you could test [~law* intitle:links] and then add ~law* as one of your research phrases if it seems productive. It's not super productive by the way, because the word "code" is a law synonym... but I wouldn't have known if I didn't test, and if I didn't test I'd end up with link prospetor results that don't have anything to do with the targets I'm seeking.

Any tips on how to best leverage Exclusions (beyond putting in sites like google.com into your Global Exclusions :D )

If you have junk, not-ops that keeps turning up in your reports, add the domain as domain.com and www.domain.com to the exclusions file. Poof. It's gone from future reports you run.

You can even add the domains you've already viewed so they won't show up anymore. Be careful though - make sure you're adding them to your campaign-level excludes rather than Global.

How often do you update the tool and what is coming down the pike?

If you sign up and you find yourself asking "I wonder what would happen if I..." please write me an email. If I don't have an answer for you I will send you credits for you to do some testing. I will end up learning from you. I have users continually pushing the limits with the tool and finding new ways to use it.

We've added PR for domains, titles and snippets for each URL, blog-only search, and fixed numerous bugs and inefficiencies based on requests from our users. We're also bringing in DA, MozRank and an API because of user requests.

Thanks Garrett!!

Free Trial and Pricing

Citation Labs is currently offering a free trial. They have monthly and per credit (love that!) pricing as well. You can find their pricing structure here.

General Consumer Awareness of SEM & SEO

Consumer Search Insights.

Which of the following have you heard of?

More people have heard of paid search / AdWords than have SEO / link building. One of the big issues with this question is that since it had numerous check boxes it had a lower response rate (roughly 10% vs an average of closer to 16% to 18%) & took longer for the answers to come in. In the future I can see Google adding quality score styled factors to quizes where pricing is in part based on response rate & they charge premiums for quicker responses. Anyhow, on to the results...

Vote All (1501) 
Pay Per Click 45.8% (+2.5 / -2.5)
AdWords 32.7% (+2.4 / -2.3)
SEO 21.3% (+2.1 / -2.0)
Link Building 15.9% (+1.9 / -1.8)
Ad Retargeting 14.9% (+1.9 / -1.7)

Men tend to have slightly greater awareness of SEO than women. That sort of makes sense given that most SEO conferences are heavily dominated by male attendees.

Vote Men (755)  Women (543)  Gender unknown (203) 
Pay Per Click 45.2% (+3.6 / -3.5) 45.7% (+4.2 / -4.1) 48.3% (+6.8 / -6.8)
AdWords 33.4% (+3.4 / -3.3) 32.2% (+4.0 / -3.8) 31.5% (+6.7 / -6.0)
SEO 24.8% (+3.2 / -2.9) 18.6% (+3.5 / -3.0) 15.3% (+5.6 / -4.3)
Link Building 18.9% (+2.9 / -2.6) 12.2% (+3.0 / -2.5) 14.3% (+5.5 / -4.2)
Ad Retargeting 16.4% (+2.8 / -2.5) 13.1% (+3.1 / -2.6) 13.8% (+5.4 / -4.1)

People in the 25 to 34 age range tend to be more aware of these terms than other age groups.

Vote 18-24 year-olds (229)  25-34 year-olds (316)  35-44 year-olds (162)  45-54 year-olds (227)  55-64 year-olds (182)  65+ year-olds (99) 
Pay Per Click 30.1% (+6.2 / -5.6) 50.3% (+5.5 / -5.5) 48.8% (+7.6 / -7.6) 44.9% (+6.5 / -6.3) 51.1% (+7.2 / -7.2) 51.5% (+9.6 / -9.7)
AdWords 37.1% (+6.4 / -6.0) 40.5% (+5.5 / -5.3) 32.7% (+7.6 / -6.8) 33.0% (+6.4 / -5.8) 22.0% (+6.6 / -5.4) 20.2% (+9.0 / -6.7)
SEO 21.4% (+5.8 / -4.8) 32.6% (+5.4 / -4.9) 29.6% (+7.4 / -6.5) 14.1% (+5.1 / -3.9) 13.2% (+5.7 / -4.2) 18.2% (+8.7 / -6.4)
Link Building 17.0% (+5.4 / -4.3) 17.4% (+4.6 / -3.8) 16.0% (+6.4 / -4.9) 15.9% (+5.3 / -4.2) 15.4% (+6.0 / -4.5) 12.1% (+7.9 / -5.0)
Ad Retargeting 12.2% (+4.9 / -3.6) 16.1% (+4.5 / -3.6) 17.3% (+6.6 / -5.0) 18.9% (+5.6 / -4.6) 11.0% (+5.4 / -3.8) 16.2% (+8.5 / -6.0)

The map is sort of all over the map...there are no easily definable regional patterns.

Vote The US Midwest (320)  The US Northeast (415)  The US South (432)  The US West (316) 
Pay Per Click 43.8% (+5.5 / -5.3) 47.5% (+4.8 / -4.8) 43.1% (+4.7 / -4.6) 48.7% (+5.5 / -5.5)
AdWords 33.1% (+5.3 / -4.9) 30.6% (+4.6 / -4.2) 33.1% (+4.6 / -4.3) 34.5% (+5.4 / -5.0)
SEO 18.1% (+4.6 / -3.8) 24.3% (+4.4 / -3.9) 19.2% (+4.0 / -3.4) 22.2% (+4.9 / -4.2)
Link Building 15.3% (+4.4 / -3.5) 13.5% (+3.6 / -3.0) 18.5% (+3.9 / -3.4) 16.1% (+4.5 / -3.6)
Ad Retargeting 13.8% (+4.2 / -3.3) 14.2% (+3.7 / -3.0) 17.1% (+3.8 / -3.3) 13.6% (+4.2 / -3.3)

People in urban areas tend to be more aware of SEM terms than rural people are. This is not particularly surprising since in smaller towns word of mouth and word around the town goes a long way (I used to live in a town of 1200 people) and in cities there is a lot more options than any one person can try & there is far greater noise/competition in the marketplace, both from a consumer and business perspective.

The "unknown" density category only had 32 total responses, so that is just noise.

Vote Urban areas (793)  Rural areas (113)  Suburban areas (563)  Urban Density unknown (32) 
Pay Per Click 45.4% (+3.5 / -3.4) 38.9% (+9.2 / -8.5) 47.8% (+4.1 / -4.1) 43.8% (+16.9 / -15.6)
AdWords 35.6% (+3.4 / -3.3) 27.4% (+8.9 / -7.4) 29.3% (+3.9 / -3.6) 40.6% (+17.1 / -15.1)
SEO 24.7% (+3.1 / -2.9) 15.9% (+7.8 / -5.6) 16.9% (+3.3 / -2.9) 31.2% (+17.3 / -13.3)
Link Building 15.5% (+2.7 / -2.4) 17.7% (+8.1 / -5.9) 16.2% (+3.3 / -2.8) 12.5% (+15.6 / -7.5)
Ad Retargeting 14.6% (+2.6 / -2.3) 19.5% (+8.3 / -6.2) 13.3% (+3.1 / -2.6) 31.2% (+17.3 / -13.3)

There are not many clear patterns among income (that surprises me as I would have thought there was a strong correlation). However, once again, the data is skewed to exclude most people with higher incomes, as there was only 1 response at > $150,000 / year.

Here is the opening chart, followed by the same chart

Vote People earning $0-24K (178)  People earning $25-49K (828)  People earning $50-74K (371)  People earning $75-99K (88)  People earning $100-149K (24)  People earning $150K+ (1)  Income unknown (11) 
Pay Per Click 43.3% (+7.3 / -7.1) 44.2% (+3.4 / -3.3) 48.8% (+5.1 / -5.0) 52.3% (+10.1 / -10.3) 50.0% (+18.6 / -18.6) 0.0% (+79.3 / -0.0) 45.5% (+26.5 / -24.2)
AdWords 34.3% (+7.2 / -6.6) 31.9% (+3.3 / -3.1) 35.0% (+5.0 / -4.7) 28.4% (+10.2 / -8.4) 20.8% (+19.6 / -11.6) 100.0% (+0.0 / -79.3) 45.5% (+26.5 / -24.2)
SEO 21.9% (+6.6 / -5.4) 20.4% (+2.9 / -2.6) 23.7% (+4.6 / -4.0) 13.6% (+8.7 / -5.7) 29.2% (+20.0 / -14.3) 0.0% (+79.3 / -0.0) 36.4% (+28.3 / -21.2)
Link Building 19.1% (+6.4 / -5.1) 16.3% (+2.7 / -2.4) 14.6% (+4.0 / -3.2) 12.5% (+8.5 / -5.4) 12.5% (+18.5 / -8.2) 0.0% (+79.3 / -0.0) 9.1% (+28.6 / -7.5)
Ad Retargeting 13.5% (+5.8 / -4.3) 14.1% (+2.5 / -2.2) 17.0% (+4.2 / -3.5) 12.5% (+8.5 / -5.4) 20.8% (+19.6 / -11.6) 0.0% (+79.3 / -0.0) 27.3% (+29.3 / -17.5)

Here is the chart again with those last 2 columns lopped off

Vote People earning $0-24K (178)  People earning $25-49K (828)  People earning $50-74K (371)  People earning $75-99K (88)  People earning $100-149K (24) 
Pay Per Click 43.3% (+7.3 / -7.1) 44.2% (+3.4 / -3.3) 48.8% (+5.1 / -5.0) 52.3% (+10.1 / -10.3) 50.0% (+18.6 / -18.6)
AdWords 34.3% (+7.2 / -6.6) 31.9% (+3.3 / -3.1) 35.0% (+5.0 / -4.7) 28.4% (+10.2 / -8.4) 20.8% (+19.6 / -11.6)
SEO 21.9% (+6.6 / -5.4) 20.4% (+2.9 / -2.6) 23.7% (+4.6 / -4.0) 13.6% (+8.7 / -5.7) 29.2% (+20.0 / -14.3)
Link Building 19.1% (+6.4 / -5.1) 16.3% (+2.7 / -2.4) 14.6% (+4.0 / -3.2) 12.5% (+8.5 / -5.4) 12.5% (+18.5 / -8.2)
Ad Retargeting 13.5% (+5.8 / -4.3) 14.1% (+2.5 / -2.2) 17.0% (+4.2 / -3.5) 12.5% (+8.5 / -5.4) 20.8% (+19.6 / -11.6)

Paid Placement in Search Engines

Consumer Search Insights.
In the below poll we didn't make any distinction between AdWords & organic SEO investments. If we did I am not sure how it would have impacted the voting.

How do you feel about people paying for placement in search engines?

Nearly 2 in 3 people dislike money manipulating search results.

response All (1201) 
I think it is deceptive 65.4% (+3.3 / -3.5)
It is good if it is relevant 34.6% (+3.5 / -3.3)

Women tend to dislike it slightly more than men.

answer Men (813)  Women (388) 
I think it is deceptive 63.6% (+3.6 / -3.8) 67.2% (+5.4 / -5.9)
It is good if it is relevant 36.4% (+3.8 / -3.6) 32.8% (+5.9 / -5.4)

Older people tend to think money influencing search is manipulative, as do younger people who have not had their idealism beaten out of them by the harshness of the world. However the people in the 25 to 34 range who grew up with the web tend to like paid search far more than other groups do.

response 18-24 year-olds (350)  25-34 year-olds (266)  35-44 year-olds (164)  45-54 year-olds (194)  55-64 year-olds (148)  65+ year-olds (80) 
I think it is deceptive 61.3% (+5.0 / -5.2) 47.9% (+6.6 / -6.6) 63.8% (+7.0 / -7.7) 72.5% (+5.8 / -6.7) 72.8% (+6.9 / -8.1) 70.6% (+9.9 / -12.3)
It is good if it is relevant 38.7% (+5.2 / -5.0) 52.1% (+6.6 / -6.6) 36.2% (+7.7 / -7.0) 27.5% (+6.7 / -5.8) 27.2% (+8.1 / -6.9) 29.4% (+12.3 / -9.9)

People in the south tend to dislike money influencing search than any other region & people out west are more accepting of it. Perhaps the audience from California is more likely to understand how search impacts the local economy?

answer The US Midwest (267)  The US Northeast (333)  The US South (355)  The US West (246) 
I think it is deceptive 64.3% (+6.9 / -7.5) 66.4% (+5.9 / -6.4) 69.5% (+5.6 / -6.2) 59.8% (+7.4 / -7.8)
It is good if it is relevant 35.7% (+7.5 / -6.9) 33.6% (+6.4 / -5.9) 30.5% (+6.2 / -5.6) 40.2% (+7.8 / -7.4)

Rural people dislike money influencing search more than urban people do.

response Urban areas (620)  Rural areas (109)  Suburban areas (460) 
I think it is deceptive 63.2% (+4.4 / -4.6) 70.9% (+8.9 / -10.8) 65.3% (+4.9 / -5.2)
It is good if it is relevant 36.8% (+4.6 / -4.4) 29.1% (+10.8 / -8.9) 34.7% (+5.2 / -4.9)

Income has essentially no impact on the perception of the influence of money in search (though there was insufficient data at the upper end of the income range).

response People earning $0-24K (135)  People earning $25-49K (675)  People earning $50-74K (307)  People earning $75-99K (71)  People earning $100-149K  People earning $150K+ 
I think it is deceptive 65.1% (+7.4 / -8.2) 65.8% (+4.3 / -4.6) 65.4% (+6.1 / -6.7) 66.5% (+9.2 / -10.7) Insufficient data Insufficient data
It is good if it is relevant 34.9% (+8.2 / -7.4) 34.2% (+4.6 / -4.3) 34.6% (+6.7 / -6.1) 33.5% (+10.7 / -9.2) Insufficient data Insufficient data

Content Locking Ads

Consumer Search Insights.

Google recently launched a consumer insights survey product, which quizes users for access to premium content.

How do users get access to these poll questions? Google locks premium content behind them, likeso:

Google has long stated that "cloaking is bad" and that it was deceptive & users didn't like it. Earlier this year Google also rolled out an algorithm to penalize sites that were too ad heavy:

We’ve heard complaints from users that if they click on a result and it’s difficult to find the actual content, they aren’t happy with the experience. Rather than scrolling down the page past a slew of ads, users want to see content right away. So sites that don’t have much content “above-the-fold” can be affected by this change. If you click on a website and the part of the website you see first either doesn’t have a lot of visible content above-the-fold or dedicates a large fraction of the site’s initial screen real estate to ads, that’s not a very good user experience.

Also recall that the second version of the Panda update encouraged users to block sites & many programmers blocked Experts-exchange due to disliking their scroll cloaking. That in turn caused Experts-exchange to get hit & see a nose dive in traffic.

Between the above & seeing how implementation of this quiz technology works, I had to ask:
How do you feel about ads that lock content behind poll questions like this one?

Response Vote
Hate them. A total waste of time 63.7% (+3.3 / -3.4)
I am indifferent 30.8% (+3.3 / -3.1)
I love them. These are fun 5.5% (+2.5 / -1.7)

There isn't a huge split between men & women. Men hate them a bit more, but they also like them a bit more...they are just less indifferent.

Vote Men (811) Women (409)
Hate them. A total waste of time 66.1% (+3.4 / -3.6) 61.5% (+5.4 / -5.7)
I am indifferent 27.2% (+3.4 / -3.2) 34.2% (+5.6 / -5.2)
I love them. These are fun 6.7% (+2.3 / -1.7) 4.3% (+5.1 / -2.4)

Young people & old people tend to like such quizes more than people in the middle. My guess is this is because older people are a bit lonely & younger people do not value their time as much and presume it is more important that they voice their opinions on trivial matters. People just before their retirement (who have recently been hosed by the financial markets) tend not to like these polls as much & same with people in their mid 30s to mid 40s, who are likely short on time trying to balance career, family & finances.

Vote 18-24 year-olds (359) 25-34 year-olds (267) 35-44 year-olds (151) 45-54 year-olds (200) 55-64 year-olds (158) 65+ year-olds (83)
Hate them. A total waste of time 62.1% (+4.9 / -5.2) 62.6% (+6.0 / -6.4) 69.4% (+6.9 / -7.9) 64.5% (+6.5 / -7.1) 68.3% (+6.3 / -7.1) 62.3% (+10.2 / -11.4)
I am indifferent 28.9% (+4.9 / -4.5) 32.1% (+6.2 / -5.6) 24.0% (+7.6 / -6.2) 30.8% (+7.0 / -6.2) 28.4% (+6.9 / -6.0) 28.7% (+11.3 / -9.1)
I love them. These are fun 8.9% (+3.4 / -2.5) 5.3% (+3.7 / -2.2) 6.6% (+5.3 / -3.0) 4.7% (+3.7 / -2.1) 3.3% (+4.4 / -1.9) 9.0% (+9.7 / -4.9)

People out west tend to be more indifferent. Like, whatever man. This may or may not have something to do with California's marijuana laws. ;)

vote The US Midwest (280) The US Northeast (331) The US South (363) The US West (246)
Hate them. A total waste of time 65.2% (+5.6 / -6.0) 69.0% (+6.2 / -7.0) 65.6% (+5.9 / -6.4) 55.6% (+7.2 / -7.5)
I am indifferent 29.7% (+5.9 / -5.3) 25.6% (+6.8 / -5.8) 28.7% (+6.2 / -5.5) 38.7% (+7.4 / -6.9)
I love them. These are fun 5.1% (+4.5 / -2.4) 5.4% (+5.9 / -2.9) 5.7% (+4.8 / -2.7) 5.6% (+7.4 / -3.3)

Rural people tend to like such polls more than others. Perhaps it has to do with a greater longing for connection due to being more isolated?

vote Urban areas (608) Rural areas (117) Suburban areas (477)
Hate them. A total waste of time 62.6% (+4.6 / -4.9) 53.6% (+10.1 / -10.4) 63.8% (+4.8 / -5.1)
I am indifferent 32.2% (+4.8 / -4.4) 37.5% (+10.4 / -9.3) 29.1% (+5.0 / -4.6)
I love them. These are fun 5.2% (+4.4 / -2.5) 8.9% (+9.5 / -4.8) 7.2% (+5.2 / -3.1)

There aren't any conclusive bits based on income. Wealthier people appear to be more indifferent, however the sampling error on that is huge due to the small sample size.

vote People earning $0-24K (151) People earning $25-49K (670) People earning $50-74K (303) People earning $75-99K (77) People earning $100-149K (20) People earning $150K+
Hate them. A total waste of time 69.0% (+7.7 / -8.9) 62.1% (+4.4 / -4.6) 69.7% (+5.5 / -6.1) 69.7% (+9.1 / -10.9) 53.8% (+19.3 / -20.5) Insufficient data
I am indifferent 26.0% (+8.5 / -7.0) 32.6% (+4.6 / -4.3) 23.6% (+5.8 / -5.0) 26.0% (+11.1 / -8.7) 41.7% (+20.6 / -18.1) Insufficient data
I love them. These are fun 5.0% (+6.8 / -3.0) 5.3% (+4.0 / -2.4) 6.7% (+5.7 / -3.2) 4.3% (+11.8 / -3.3) 4.4% (+27.1 / -4.0) Insufficient data

So, ultimately, Google was right that users hate excessive ads & cloaking. But the one thing users hate more than either of those is paying for content. ;)

Some of the traditional publishing businesses are dying on the vine & this is certainly a great experiment to try to generate incremental revenues.

...but...

How does Google's definition of cloaking square with the above? If publishers (or a competing ad network) do the same thing without Google, would it be considered spam?

Ad Retargeting

Consumer Search Insights.

How do you feel about companies tracking your online behavior to target ads?

Surprisingly, nearly 1 in 11 people like ad retargeting. However, over 3 in 5 people dislike it.

response All (1250) 
I dislike it because it feels creepy 62.3% (+3.1 / -3.3)
I don't care either way 29.3% (+3.1 / -2.9)
I like more relevant ads 8.3% (+2.3 / -1.9)

Women tend to think being stalked by ads is creepier than men do.

vote Men (822)  Women (428) 
I dislike it because it feels creepy 60.6% (+3.7 / -3.8) 64.1% (+5.0 / -5.3)
I don't care either way 30.0% (+3.6 / -3.4) 28.7% (+5.1 / -4.6)
I like more relevant ads 9.5% (+2.6 / -2.1) 7.2% (+4.2 / -2.7)

Younger people who are old enough to be starting families tend to be more financially stressed than most other age groups, so they are likely more appreciative of relevant ads tied to discounts & such. Younger people have also used the web for so much of their lives that they are not as creeped out by tracking & privacy issues as older people are. People in retirement also like relevant ads, perhaps in part because they are feeling the Ben "printing press gone wild but no inflation" Bernake pinch & see their fixed income retirements collapse under artificially low interest rates tied to money printing game.

age 18-24 year-olds (372)  25-34 year-olds (270)  35-44 year-olds (150)  45-54 year-olds (217)  55-64 year-olds (164)  65+ year-olds (77) 
I dislike it because it feels creepy 60.2% (+4.8 / -5.0) 52.3% (+6.3 / -6.4) 65.1% (+7.2 / -8.0) 66.0% (+6.1 / -6.6) 66.6% (+6.9 / -7.7) 55.7% (+11.2 / -11.8)
I don't care either way 33.6% (+4.9 / -4.6) 35.0% (+6.4 / -5.9) 25.5% (+7.6 / -6.3) 27.9% (+6.4 / -5.6) 26.9% (+7.5 / -6.3) 33.5% (+11.9 / -10.1)
I like more relevant ads 6.2% (+2.9 / -2.0) 12.7% (+5.1 / -3.8) 9.5% (+5.9 / -3.8) 6.1% (+3.9 / -2.5) 6.4% (+5.2 / -2.9) 10.7% (+9.1 / -5.2)

People from the west coast are perhaps slightly more aware of the risks of online tracking. People from the south couldn't care either way. In the midwest the stereotype of the mom who clips coupons is shown in the data (though the sample size is small).

vote The US Midwest (259)  The US Northeast (340)  The US South (404)  The US West (247) 
I dislike it because it feels creepy 58.5% (+6.5 / -6.9) 61.8% (+5.9 / -6.3) 61.6% (+5.7 / -6.0) 67.2% (+6.2 / -6.8)
I don't care either way 29.9% (+6.6 / -5.9) 29.1% (+5.8 / -5.2) 32.4% (+5.9 / -5.4) 24.6% (+6.7 / -5.6)
I like more relevant ads 11.6% (+5.6 / -4.0) 9.1% (+5.0 / -3.3) 6.0% (+4.6 / -2.7) 8.2% (+5.7 / -3.5)

On everything outside of disliking online tracking the margin of error is wide enough that it is somewhat hard to notice any strong patterns based on population data.

vote Urban areas (636)  Rural areas (108)  Suburban areas (480) 
I dislike it because it feels creepy 58.9% (+5.0 / -5.1) 61.1% (+9.0 / -9.8) 62.6% (+4.5 / -4.7)
I don't care either way 32.3% (+5.1 / -4.7) 33.9% (+9.9 / -8.6) 27.6% (+4.5 / -4.1)
I like more relevant ads 8.8% (+4.4 / -3.0) 5.0% (+8.7 / -3.3) 9.8% (+3.6 / -2.7)

It is also hard to see much of a broad pattern based on income levels.

vote People earning $0-24K (150)  People earning $25-49K (691)  People earning $50-74K (304)  People earning $75-99K (88) 
I dislike it because it feels creepy 62.2% (+8.4 / -9.1) 60.2% (+4.2 / -4.4) 66.5% (+5.8 / -6.4) 55.1% (+10.2 / -10.6)
I don't care either way 30.0% (+9.2 / -7.8) 30.8% (+4.3 / -4.0) 25.9% (+6.1 / -5.3) 35.8% (+10.4 / -9.2)
I like more relevant ads 7.9% (+8.6 / -4.3) 9.0% (+3.7 / -2.7) 7.5% (+5.5 / -3.3) 9.2% (+9.0 / -4.8)

Google+ Integration

Consumer Search Insights.
As publishers we tend to be quite concerned with the over-promotion of Google+ because it carves up the search landscape, is potentially another hoop that we have to jump through, and in some cases, the Google+ hosted version of a page will outrank the legitimate original source - which screws up the economics of online publishing.

But do users care about how Google+ was integrated directly into the search results? Generally no.

How do you feel Google+ integration has impacted Google's relevancy?

Under 1 in 5 people said it made the search results better, under 1 in 5 said it made the search results worse & over 3 in 5 didn't notice any material impact.

vote All (1260) 
no noticeable impact 64.7% (+3.3 / -3.5)
made it better 17.4% (+2.9 / -2.6)
made it worse 17.9% (+3.0 / -2.7)

Men liked it slightly more than women. However, that difference was within the estimated range of error. If this difference was more significant one might guestimate that women are better at socializing offline & have less need for artificial web relationships, given their relatively larger corpus callosum. ;)

vote Men (875)  Women (385) 
no noticeable impact 64.1% (+3.4 / -3.6) 65.3% (+5.5 / -5.9)
made it better 18.7% (+3.0 / -2.6) 16.2% (+5.2 / -4.1)
made it worse 17.2% (+2.9 / -2.6) 18.5% (+5.3 / -4.4)

Older people are less likely to have loads of online friends & relationships (as they spent most of their lives building relationships in the physical world, before the web or online social networks were popular). Older people also tend to be more set in their ways. Thus many older people won't be signed up for Google+ & won't notice as much of an impact from it.

Younger people are more likely to want to try out new technology, thus they are more likely to notice an impact from it. Some generations tend to be more isolated & individualistic (like the baby boomers) while millennials tend to like to work in groups & network more (it isn't an accident that Facebook started on a college campus & targeted college students), thus younger people are not only more likely to notice something like Google+, but they are also more likely to like its impact.

vote 18-24 year-olds (334)  25-34 year-olds (322)  35-44 year-olds (141)  45-54 year-olds (204)  55-64 year-olds (167)  65+ year-olds (93) 
no noticeable impact 59.8% (+5.1 / -5.4) 64.0% (+5.4 / -5.7) 66.6% (+7.3 / -8.2) 59.3% (+6.6 / -7.0) 65.7% (+6.9 / -7.7) 73.9% (+8.1 / -10.1)
made it better 26.6% (+5.0 / -4.4) 18.8% (+5.0 / -4.1) 16.3% (+7.2 / -5.3) 19.1% (+6.2 / -4.9) 16.4% (+6.7 / -5.0) 7.9% (+8.7 / -4.3)
made it worse 13.6% (+4.1 / -3.3) 17.2% (+4.8 / -3.9) 17.1% (+7.4 / -5.5) 21.6% (+6.0 / -5.0) 17.9% (+6.5 / -5.0) 18.2% (+9.9 / -7.0)

I didn't notice any obvious trends or patterns aligned with locations across the country.

vote The US Midwest (267)  The US Northeast (360)  The US South (378)  The US West (255) 
no noticeable impact 65.5% (+6.7 / -7.3) 61.3% (+7.3 / -7.8) 67.6% (+5.6 / -6.1) 62.4% (+6.6 / -7.1)
made it better 16.2% (+6.2 / -4.7) 20.5% (+7.8 / -6.1) 17.2% (+5.0 / -4.1) 16.5% (+6.3 / -4.8)
made it worse 18.4% (+6.9 / -5.3) 18.2% (+6.3 / -4.9) 15.1% (+5.6 / -4.3) 21.1% (+6.6 / -5.3)

Suburban people were more likely to notice an impact, though they were not heavily skewed in one way or the other

vote Urban areas (669)  Rural areas (124)  Suburban areas (450) 
no noticeable impact 65.9% (+4.1 / -4.4) 66.8% (+9.0 / -10.4) 62.0% (+4.7 / -5.0)
made it better 16.4% (+3.7 / -3.1) 14.3% (+8.5 / -5.7) 20.4% (+4.4 / -3.8)
made it worse 17.6% (+3.9 / -3.3) 18.9% (+9.8 / -7.0) 17.6% (+4.2 / -3.6)

People who earned less were less likely to notice positive or negative impact from Google+ integration (somewhat surprising since younger people tend to skew toward lower incomes & younger people were more likely to notice & like Google+ integration). Outside of that, the data is too bunched up to see any other significant patterns based on income.

vote People earning $0-24K (162)  People earning $25-49K (698)  People earning $50-74K (312)  People earning $75-99K (71) 
no noticeable impact 71.1% (+7.8 / -9.2) 62.8% (+4.4 / -4.6) 61.9% (+6.3 / -6.8) 61.3% (+10.6 / -11.9)
made it better 14.8% (+8.8 / -5.9) 17.5% (+4.0 / -3.4) 18.9% (+5.9 / -4.8) 17.1% (+11.5 / -7.5)
made it worse 14.1% (+9.5 / -6.1) 19.7% (+4.3 / -3.7) 19.2% (+6.4 / -5.1) 21.6% (+11.2 / -8.1)

Editorial Objectivity

Consumer Search Insights.

Should search engines be able to preferentially promote their own services in their search results?

Nearly 3 in 4 people think that search engines should not be able to preferentially promote their own services.

vote All (1226)
no, results should be objective 74.1% (+3.1 / -3.4)
yes, it is their search results 25.9% (+3.4 / -3.1)

There was essentially no split between men & women.

vote Men (827) Women (399)
no, results should be objective 73.7% (+3.1 / -3.4) 74.4% (+5.2 / -6.0)
yes, it is their search results 26.3% (+3.4 / -3.1) 25.6% (+6.0 / -5.2)

Older people tend to prefer/want more editorial objectivity, whereas younger people are more fine with search engines preferentially promoting their own services. Older people tend to be more fixed in their ways & younger people are much less so.

vote 18-24 year-olds (338) 25-34 year-olds (269) 35-44 year-olds (158) 45-54 year-olds (209) 55-64 year-olds (169) 65+ year-olds (83)
no, results should be objective 65.0% (+4.9 / -5.2) 76.0% (+5.1 / -6.0) 74.0% (+6.5 / -7.7) 71.2% (+5.7 / -6.5) 71.4% (+6.5 / -7.5) 87.2% (+6.1 / -10.4)
yes, it is their search results 35.0% (+5.2 / -4.9) 24.0% (+6.0 / -5.1) 26.0% (+7.7 / -6.5) 28.8% (+6.5 / -5.7) 28.6% (+7.5 / -6.5) 12.8% (+10.4 / -6.1)

Geographically, people in the south & midwest tend to be slightly more trusting, perhaps due to the lower cost of living & less competitive markets. However, any differences here are fairly minor & are within the margin of error.

vote The US Midwest (244) The US Northeast (367) The US South (352) The US West (263)
no, results should be objective 72.2% (+6.4 / -7.4) 77.7% (+4.5 / -5.3) 72.1% (+6.0 / -6.9) 75.9% (+5.7 / -6.9)
yes, it is their search results 27.8% (+7.4 / -6.4) 22.3% (+5.3 / -4.5) 27.9% (+6.9 / -6.0) 24.1% (+6.9 / -5.7)

People who are rural tend to be slightly more accepting of Google doing as it wishes, though this is also a small sample size & well within the margin of error.

vote Urban areas (647) Rural areas (106) Suburban areas (453)
no, results should be objective 74.3% (+4.3 / -4.9) 71.9% (+8.5 / -10.5) 74.4% (+4.2 / -4.7)
yes, it is their search results 25.7% (+4.9 / -4.3) 28.1% (+10.5 / -8.5) 25.6% (+4.7 / -4.2)

There isn't a strong correlation with income on this issue either. People cared a bit more at higher income levels, but there was also a wider margin of error due to small sampling size.

vote People earning $0-24K (142) People earning $25-49K (677) People earning $50-74K (316) People earning $75-99K (75) People earning $100-149K People earning $150K+
no, results should be objective 72.0% (+7.8 / -9.4) 76.8% (+3.7 / -4.1) 68.7% (+6.1 / -6.8) 83.1% (+6.9 / -10.2) Insufficient data Insufficient data
yes, it is their search results 28.0% (+9.4 / -7.8) 23.2% (+4.1 / -3.7) 31.3% (+6.8 / -6.1) 16.9% (+10.2 / -6.9) Insufficient data Insufficient data

Jim Boykin Interview

Internet Marketing Ninja Jim Boykin has promoted link building since before I even knew what SEO was. Nearly a decade later so many things have changed in SEO (including renaming We Build Pages to Internet Marketing Ninjas), but he still sees links as a key SEO driver (as do I). I recently interviewed him about links & the changing face of SEO.

so, links links links ... these were the backbone of ranking in Google for years and years. are they still? Is social a huge signal, or something that has been over-hyped?

Yes, I do see backlinks at the backbone of rankings in Google. Every day I see sites that trump the rankings with links, and no social signals...but I've never seen a site that had "poor" backlinks compared to others, but a strong social signal, be ranked great.

There are other signal that I feel are more important than social, like content and user behavior, but then after those, I'd put social signals. Even though I don't think they're more important thank links by any stretch, I do feel that social has a place, in areas like branding, community building, and in assisting in organic search results. I always recommend that people have a strong social presence, even if for only sending additional signals to Google to assist in higher rankings.

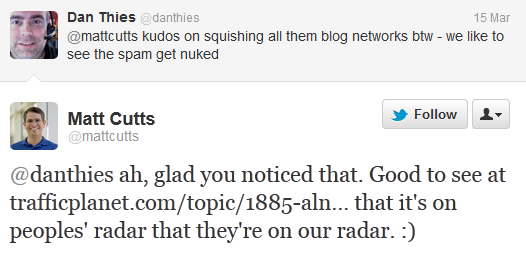
Google recently nailed a bunch of lower quality bulk link networks. Were you surprised these lasted as long as they did? Was the fact that they worked at all an indication of the sustained importance of links?

Well...surprised...no... filtering out networks is something that's always going to happen....once something gets too big, or too popular, or too talked about...then it's in danger of being burned... the popular "short cuts" of today are the popular penalized networks of tomorrow... there will always be someone who will create a network (of others sites they control, or their new friends control, or of near expired domains, or blogger groups, etc etc) and that someone will start selling links, and advertising, and it will catch on, and they will sell to everyone and it will become so interconnected that it will cause it's own algorthymitic penalty, or it will get popular, and get the eyes of Google on it, and then it will get filtered, or there will be exact match penalties, or entire site penalties.

If that's the game you play, just understand the risks...or, don't play that game and give other reasons for people to link to you, and get permanent non-paid links, but that takes a lot of time and effort and marketing. That's the price you have to pay...because, yes, rankings in Google still comes down to #1, Links.

After such networks get hit, how hard is it for such sites to recover? Does it create a "flight to quality" impact on link building? Are many of them better off starting from scratch rather than trying to recover the sites?

We've worked with several people who have come to us with after being penalized by Google to some degree (either phrase based penalty, or entire site penalties). Probably the low budget people who got hit just started other sites and tossed their penalized site, but most of the people who come to us can't afford to toss their branded site away.

In almost all of those cases it takes someone removing all the paid and un-natural links that they can. They must understand then that their days of buying links are Over, and they Must create great things on their site that gets natural links....and they must forever give up the chase of being #1 for the big short tail phrases..unless you own the exact .com, or your brand name includes that phrase...In order to recover, they must purge the backlinks of the paid links and the networks, do a reinclusion request, and then start doing "natural things", and then wait and wait and wait...90 days is typical...it's the one Google gave to themselves after you pointed out that Google themselves were buying blog links.

Over time it has become easier to hit various trip wires when link building. You mentioned some things being phrse based or entire site & so on...how does a person determine the difference between these? Some of Google's automated penalties and manual penalties have quite similar footprints, are there easy ways to tell which is which?

A phrase based penalty work like this...let's say you've been targeting "green widgets" and "red widgets" for years...you have lots of backlinks with those exact anchor text....and you were in the top 10 for both phrases....then one day, you rank somewhere on page 3 or higher for those phrases.. you may still rank #3 for "cheap red widgets" or #7 for "widgets green" (reversed phrases)...but for the few exact phrases...it's page 3+ of the SERPS for you....nothing else changes, just those exact phrases.. on the other hand, a sitewide penalty is where pretty much nothing rankings on page 1 or page 2 in the SERPS, when the prior day you had lots of keywords rankings in there. I have no way of knowing which were automatic and which were hand done....sometimes I have a feeling in my gut...but it doesn't really matter...the solution is always the same...clean up the backlinks, and change your methods.

Earlier you mentioned foregoing the head phrase, in spite of things like Google Instant guiding searchers down a path, is there still plenty of tail to be had? Are tail keywords significantly under-rated by the market? How does one square going after tail keywords with algorithms like Panda?

I'm a big believer in the long tail. When we analyze content on a site we tend to grab ranking data from ahrefs for the client, as well as for several of their competitors, and we end up merging all the phrases and showing the search volume and the average cost per click for each phrase...we can always find a huge long tail, even if the clients site currently doesn't have that content (they have to add new original content), there is always a huge long tail to be had.

In 98% of the cases, there are no one or two or three main phrases that account for more than 2% of the total potential search traffic. Even with a sites existing content and existing traffic, the short tail tends not to be more than 5% of traffic for any sites I've been seeing.We often find that a site that may have 5,000 pages, but only 500 pages that site are of value via ranking for anything that has a decent search volume, and a decent worth in a CPC value in Google. If you look at those 500 urls, and you optimize each url for say 5 phrases on average, then you're looking at 2,500 phrases...of those, 50 phrases might be the short tail, and 2450 I would consider the middle tail. If you also add words like "shop" "store" "online" "sale" "cheap" "discount" etc to all those pages, you'll pick up tons more phrases. And from there, the more original content you can add, the more long tail you can get.... but..be careful...no one wants a site to be hit from a Google panda update...make sure the content is original, of value, and that it's of use to the viewers of the page.

When going after head or tail keywords...with one or the other do you feel that link quality is more important than link quantity?

Link quality always trumps. Otherwise, I'd buy those 10,000 backlinks for $100 packages that I see in Google AdWords... and my job would be a lot easier :)

With Google it is getting easier to hit tripwires with anchor text or building links too fast, does this also play into the bias toward quality & away from quantity?

I think it is easier to hit tripwires...but it's nice that Google sent out 700,000 "be careful" emails a few weeks ago... those were automatic....I think the "over optimization update" that Google has been speaking of will trip a lot of wires and people will have to mimic the natural web more and not focus on exact short tail phrases.

Those scammy AdWords ads proming link riches for nothing in part shape the perception of the cost & value of links. How do you get prospective clients to see & appreciate the value of higher quality links (while in some cases some of them will be competing with some of the bulk stuff that ranks today & is gone tomorrow)?

Well, luckily I'm not in sales calls anymore so I don't have to do the convincing :) but I'd say that if you can get links that you just can't buy (ie, a link from NASA.gov or harvard.edu/library/) then they're priceless. Each update Google will filter out some of the links from sites that it feels are artificial. If you can build things that stick and stand the test of time, and if you don't need to be #1 tomorrow, and are willing to invest in the sites content and the sites future, then think long tail and long term. If you're all about today, then do what you have to do today, but those cheap links won't move you much anyways & you'll just have a spammy backlink profile.

Building quality links that last isn't particularly cheap or easy. Even harder to do it in volume. What has allowed/enabled you to succeed where so many others have failed on this front? Is it that you care more about the client's well being, or is it that you have to tie together a bunch of clever bits to make it all back out?

Well, I have an army here....nearly 100 ninjas..the biggest group is the link builders, so I have a lot of link ninjas, we also have a lot of tools...tools that suggest the things we should write that has the highest probability of getting trusted backlinks, we have a content teams that knows how to write to get links from professors and orgs and government agencies, etc.

We have tools that help us to know who to write to after we've written the content..and we have tools that help us send out a lot of personal emails...between the tools and the people and the content, we manage to make it work. If we had to do all the work by hand, and by human guesses, it would never work, but with the tools (and human intervention along the way), we're able to get the links and scale it, while keeping the high quality.

When you talk about getting quality links that are priceless, those have that sort of value precisely because they are so hard to get. How big of a role does content play in the process? Is this something anyone can do?

Content is Key to getting links. There's different types of links....there's the low hanging fruit..then there's the fruit that's way on the top of the tree....the things that tend to be harder to get, also tend to be the most valued and the most trusted. If I wrote to a college professor at Harvard and said, "Hey, Professor Bob, I just wrote a great paper on "The History Of Widgets", you should add it to your article in the Harvard library" then if the article isn't Great, they'll never link to it. It starts with a great idea that morphs into great content, and then we promote it to those we're targeting. Anyone can write this content, guess at what a gov page would link to, or a college professor..see what they currently link out to...write them an email that's been personalized...and with enough emails, you can get the links if your content is good enough. It's a long slow process, but anyone can do it. Thank goodness I have tool that make that process much easier and more accurate to getting links.

You mentioned thinking long term, how long does it usually take to start seeing results from quality link building? Do you ever work on new sites, or do you mostly try to work on older websites that tend to respond quicker? Also have you noticed newer sites being able to rank much quicker if they do a quality-first approach to link building?

With getting the trusted links we tend to see an increase in traffic during the first 3 months. I do the 3 month review phone calls here, and my goal is to show them the ROI via overall rankings increase of the long tail, and an increase in google's organic traffic. Sites tend to see much better increases in these if they also follow our internal linking strategies, and our on page optimization strategies. If someone does link building, on page optimization, and internal linking, after 3 months there's almost no way someone can not increase the traffic to their site.

----

Thanks Jim!

Jim Boykin is the founder and CEO of Internet Marketing Ninjas (formerly We Build Pages, since 1999). Jim's team of marketing ninjas offer a full range of internet marketing services including link building services and social media branding, as well as they employ an in-house team of website designers. Follow Jim and the Ninjas on their blog, Facebook, Google, and Twitter, foursquare, and Linkedin.

Patience is a Virtue

Sorry I haven't blogged as much lately, but one of our employees recently had a child and Google sending out so many warning messages in webmaster central has created a ton of demand for independent SEO advice. Our growth in demand last month was higher than any month outside of the time a few years ago when we announced we would be raising prices and got so many new subscribers that I had to close down the ability to sign up for about 3 or 4 months because there were so many new customers.

Google has been firing on all cylinders this year. They did have a few snafus in the press, but those didn't have any noticeable impact on user perception or behavior & Google recently rolled out yet another billion Dollar business in their consumer surveys.

Google is doing an excellent job of adding friction to SEO & managing its perception to make it appear less stable, less trustworthy and to discourage investment in SEO. They send out warnings for unnatural links, warnings for traffic drops, and even warnings for traffic increases.

Webmaster Tools is a bit of a strange bird...

  • Any SEO consultant who has client sites tied into Webmaster Tools makes it easy to connect them together (making any black swan editorial decisions far riskier).
  • Any SEO company which has clients sign up for their own Webmaster Tools account now has to deal with explaining why things change, when many of the changes that happen are more driven by algorthmic shifts (adding local results to the SERPs or taking them away, other forms of localization, changing of ad placement on the SERP, etc.) than by the work of the SEO. This in turn adds costs to managing SEO projects while also making them seem less stable (even outside of those who were use paid link networks). Think through the sequence...
    • Google first sends a warning for traffic going up, and the SEO tells the client that this is because they did such a great job with SEO.
    • Then Google sends a warning for traffic dropping & the client worries that something is wrong.
    • The net impact on actual traffic or conversions could be a 0, but the warnings amplify the perception of changes.
  • Any SEO who doesn't use Webmaster Tools loses search referral data. It first started with logged in Google users, but apparently it is also headed to Firefox. Who's to say Google Chrome & Safari won't follow Firefox at some point?

Google has changed & obfuscated so many things that it is very hard to isolate cause and effect. They have made changes to how much data you get, changes to their analytics interface & how they report unique visitors, changes to how tightly they filter certain link behaviors, they have rolled in frequent Panda updates, and they have nailed a number of the paid link networks.

BuildMyRank shut down after leaving a self-destructive footprint that made it easy for Google to nuke their network, and some of the remaining paid link networks are getting nailed. Some of their customers are at this point driven primarily by fear, counting down their remaining days as the sky is falling. Fear is an important emotion designed to protect us, but when it is a primary driver we risk self-destruction.

The big winners in these moves by Google are:

  • Google, since they grant themselves more editorial leeway. If everyone is a scofflaw then they can hit just about anyone they want. And the organic search results are going to be far easier to police if many market participants are held back by a fear tax.
  • Larger businesses which are harder to justify hitting & which can buy out smaller businesses at lower multiples based on the perception of fear.
  • Sites which were outranked by people using the obvious paid links, which now rank a bit better after some of those paid link buyers were removed from the search results.
  • SEOs who out others & market themselves by using polarizing commentary (at least in the short run, whereas in the long run that may backfire).
  • Those engaging in negative SEO, which sell services to smoke competitors.

The big losers from these Google moves are:

  • some of the paid link networks & those who used them for years
  • under-priced SEO service providers who were only able to make the model work by scaling up on risk
  • smaller businesses who are not particularly spammy, but are so paralyzed by fear that they won't put in enough effort & investment to compete in the marketplace

One of the reasons I haven't advocated using the paid link networks is I was afraid of putting the associated keywords into a hopper of automated competition that I would then have to compete against year after year. Even if you usually win, over the course of years you can still lose a lot of money by promoting the creation of disposable, automated & scalable competing sites. If you don't mind projects getting hit & starting over the ROI on such efforts might work out, but after so many years in the industry the idea of starting over again and again as sites get hit is less appealing.

It is not just that the links are not trusted, but now they stand a far greater chance of causing penalties:

Dear site owner or webmaster of ….

We’ve detected that some of your site’s pages may be using techniques that are outside Google’s Webmaster Guidelines.

Specifically, look for possibly artificial or unnatural links pointing to your site that could be intended to manipulate PageRank. Examples of unnatural linking could include buying links to pass PageRank or participating in link schemes.

We encourage you to make changes to your site so that it meets our quality guidelines. Once you’ve made these changes, please submit your site for reconsideration in Google’s search results.

If you find unnatural links to your site that you are unable to control or remove, please provide the details in your reconsideration request.

If you have any questions about how to resolve this issue, please see our Webmaster Help Forum for support.

Sincerely,

Google Search Quality Team

If that doesn't change then negative SEO will become a bigger issue than paid links ever were.

What is hard about Google penalizing websites for such links is that it is cheap & easy for someone else to set you up. Shortly after Dan Thies mentioned that it was "about time" to Matt Cutts on Twitter someone started throwing some of the splog links at his site. It is safe to say that Dan didn't build those links, but there are many people who will be in the same situation as Dan who did nothing wrong but had a competitor set them up.

And there is no easy way to disconnect your site from those types of links.

If you go back a few years, it was quite easy to win at SEO by doing it in a "paint by number" fashion. One rarely got hit unless they were exceptionally excessive and stuck out like a sore thumb.

But after all of Google's recent moves, a few missed steps in a drunken stupor can have the same result.

Now more than ever, patience is a virtue!