
For the following study, we asked "Does this search result have ads on it? " to 1,000 searchers, per search results. Due to these surveys requiring a smaller image (to fit the ad unit size) we chose search results that generally had more ads on them (typically 3 or 4) so that the background had a significant portion of real estate devoted to ads, in spite of its small size. The one exception here was DuckDuckGo, as it only displays one ad at most even on highly commercial keywords like credit cards.
Other than resizing the search result to fit, the only modifications we generally made were removing the graphic picture from the Wikipedia page near the top of the DuckDuckGo SERP (since a prior study showed that users presumed there was a correlation between graphics and the perception of ads) and that in most cases we removed the right sidebar. We did include the sidebar ads on 3 different Bing, Google, & Yahoo! search results so that we could compare the impact of sidebar ads vs not having a sidebar.
Executive Summary
The 3 big takeaways are:
- For most search engines, people are generally unaware of ads vs organic results if there are no ads in the right column ... most of these yes/no questions came down to about a 50/50 vote, even though all of them had ads on them. It is every bit as true today as it was in 2003.
-
If there is a right column, the percent of people who voted that there are ads on the page jumps significantly. Thus it is pretty safe to say that people think ads are in the right column & that the right column is ads.
- Interestingly, among major search engines, Yahoo! (without sidebar) got more "yes, it has ads" votes than other search engines. In fact, Yahoo! without sidebar ads scored within 1% of Bing with sidebar ads.
Combined Survey Results
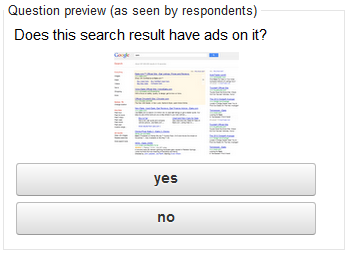
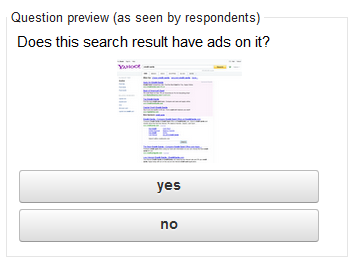
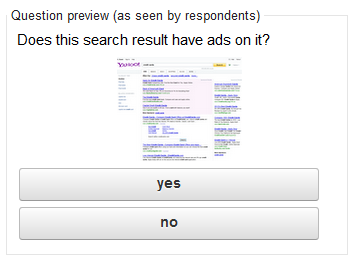
For the question Does this search results have ads on it?
| search engine |
yes |
no |
|---|
| AOL |
53.1% (+3.9 / -3.9) |
46.9% (+3.9 / -3.9) |
| Ask |
52.0% (+4.0 / -4.1) |
48.0% (+4.1 / -4.0) |
| Ask Arbitrage |
51.6% (+3.9 / -3.9) |
48.4% (+3.9 / -3.9) |
| Bing |
50.2% (+3.8 / -3.8) |
49.8% (+3.8 / -3.8) |
| Bing w Sidebar |
57.7% (+3.7 / -3.8) |
42.3% (+3.8 / -3.7) |
| Dogpile |
44.7% (+4.1 / -4.0) |
55.3% (+4.0 / -4.1) |
| Duck Duck Go |
52.3% (+3.9 / -3.9) |
47.7% (+3.9 / -3.9) |
| Google |
54.5% (+4.0 / -4.0) |
45.5% (+4.0 / -4.0) |
| Google w Sidebar |
62.9% (+3.6 / -3.8) |
37.1% (+3.8 / -3.6) |
| Yahoo! |
56.8% (+3.9 / -4.0) |
43.2% (+4.0 / -3.9) |
| Yahoo! w Sidebar |
59.8% (+3.9 / -4.1) |
40.2% (+4.1 / -3.9) |
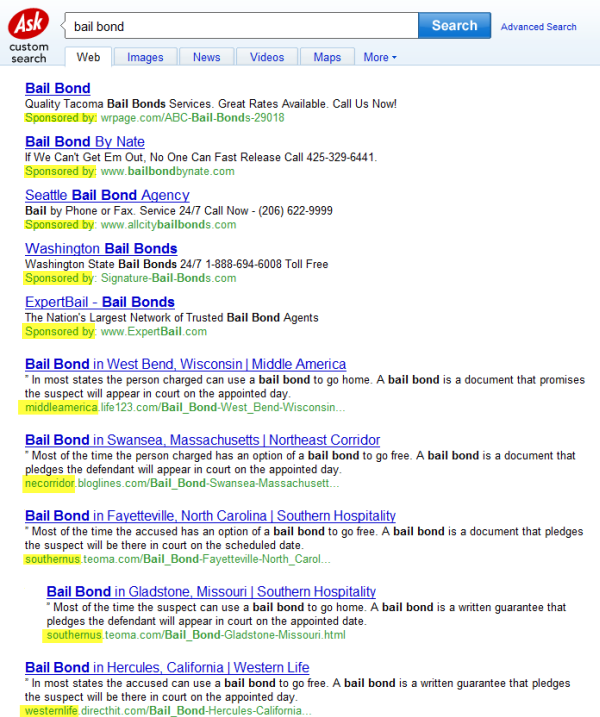
User Voting Images
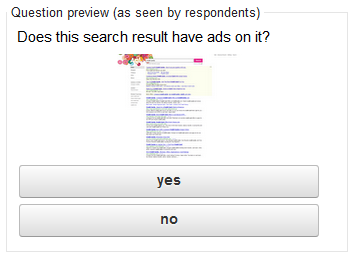
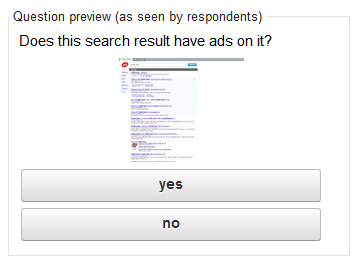
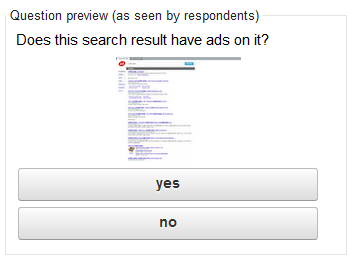
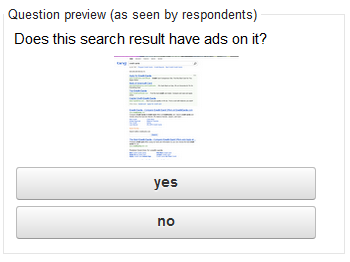
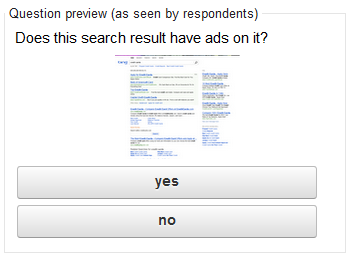
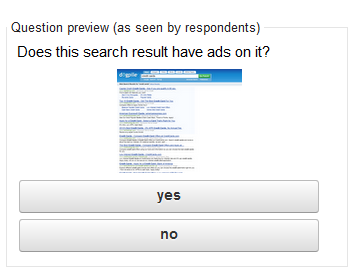
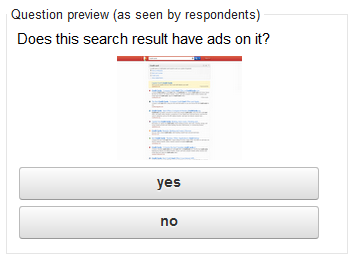
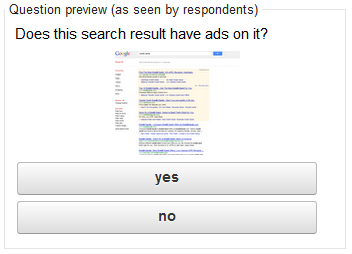
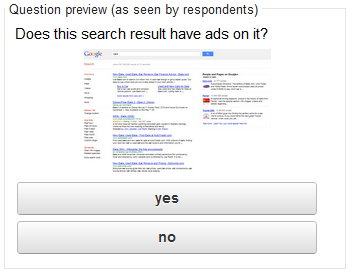
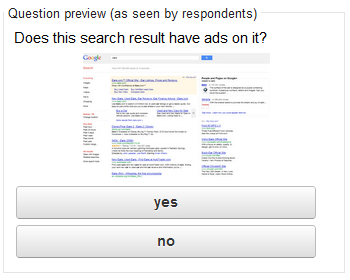
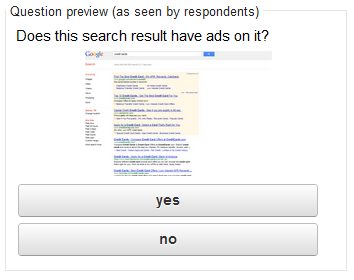
Here are the images users saw when they voted:
AOL SERP
Ask SERP
Ask Arbitrage SERP
Bing SERP
Bing With Sidebar SERP
Dogpile SERP
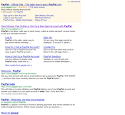
DuckDuckGo SERP
Google SERP
Google With Sidebar SERP
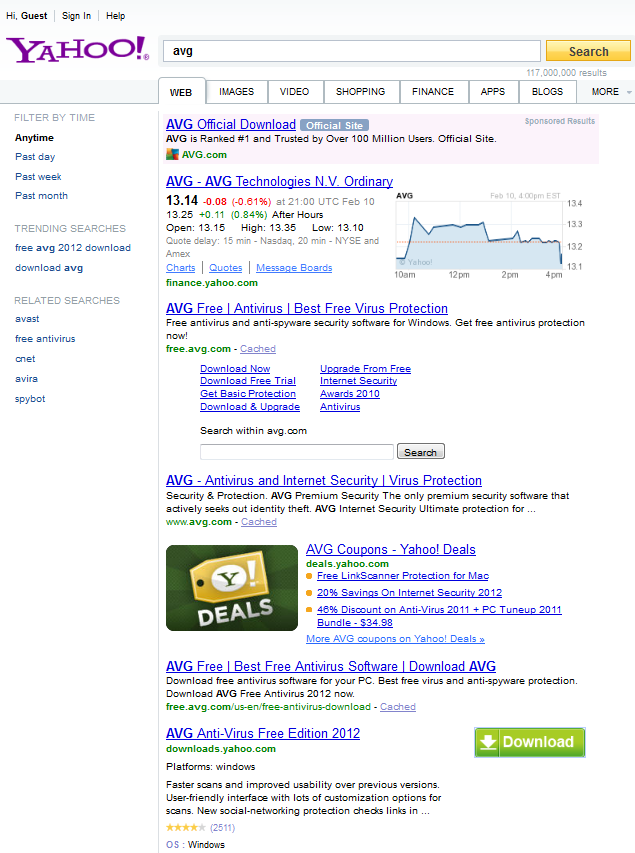
Yahoo! SERP
Yahoo! With Sidebar SERP
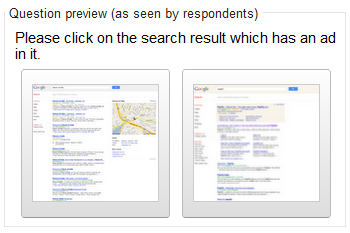
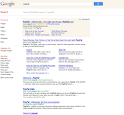
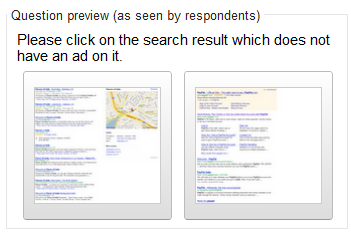
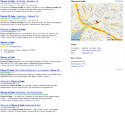
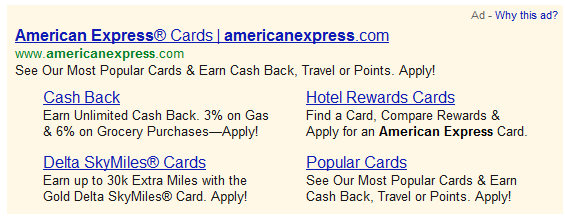
Which SERP Has an Ad? (Maps vs AdWords Ads)
Prior to doing the above study, we asked users to please click on the search result which has an ad in it, listing search results side by side. Any bias presented in this (outside of both having smaller than actual sizes) impacts both images. At first we did a regular Google SERP where we included the branding & then we followed up with one that is more zoomed in on the actual search results but does not include branding. On the one that was less zoomed in people thought the map was an ad more often, but upon further zooming they thought it was roughly 50/50.
| SERP |
All (1172) |
 Left Left |
53.7% (+3.3 / -3.4) |
 Right Right |
46.3% (+3.4 / -3.3) |
| SERP |
All (1198) |
 Left Left |
49.6% (+3.4 / -3.4) |
 Right Right |
50.4% (+3.4 / -3.4) |
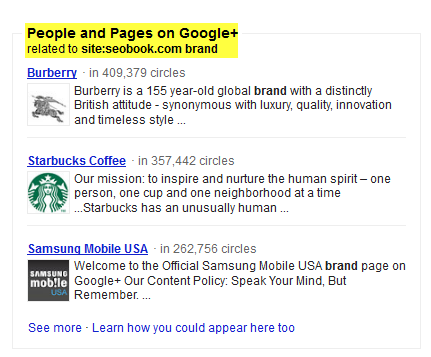
Comparing Google+ to Ads
Does this search result have ads on it?
| layout |
yes |
no |
|---|
| Google+ without ads |
56.3% (+3.1 / -3.1) |
43.7% (+3.1 / -3.1) |
| Google+ with ads |
56.9% (+3.2 / -3.2) |
43.1% (+3.2 / -3.2) |
| large top ads w/o Google+ |
53.6% (+3.2 / -3.2) |
46.4% (+3.2 / -3.2) |
Searchers tend to think that Google+ integration in the right rail is an ad unit. More people voted that Google+ without ads had ads in the search results than a SERP with 4 AdWords ad units and no Google+ integration.
Search Engine Ad Background Color
After seeing that users generally guessed no better than a coin toss at best in most cases, we decided to ask What background color do Google search results use to denote top left search advertisements? The same question was asked of Yahoo! & Bing search results.
Google
| Google |
All (1147) |
| none, they are white |
49.7% (+3.2 / -3.2) |
| blue |
25.5% (+3.0 / -2.8) |
| yellow |
10.6% (+2.3 / -2.0) |
| pink |
7.0% (+2.1 / -1.6) |
| purple |
7.2% (+2.2 / -1.7) |
Yahoo!
| Yahoo! |
All (1080) |
| none, they are white |
44.6% (+3.4 / -3.4) |
| blue |
20.9% (+3.0 / -2.7) |
| yellow |
15.6% (+2.7 / -2.4) |
| magenta |
11.2% (+2.5 / -2.1) |
| orange |
7.7% (+2.3 / -1.8) |
Bing
| Bing |
All (1063) |
| none, they are white |
49.0% (+3.6 / -3.6) |
| blue |
23.5% (+3.2 / -3.0) |
| yellow |
13.0% (+2.8 / -2.4) |
| purple |
7.5% (+2.4 / -1.9) |
| pink |
7.1% (+2.4 / -1.8) |
Summary
Bing scored highest, however blue also scored as the 2nd highest color for all 3 search engines. Nearly half of searchers believe that top ads have a white background, which highlights a general widespread lack of awareness of search ads.
| Search Engine |
% Who Answered Correctly |
| Bing (blue) |
23.5% |
| Yahoo! (magenta) |
11.2% |
| Google (yellow) |
10.6% |
Ad Location on the SERP
Given how little awareness users have of ad background color, I decided to ask: Where might ads appear on search results at top search engines like Bing & Google?
| Vote |
All (1144) |
| right column |
34.2% (+3.4 / -3.3) |
| all 3 locations |
29.6% (+3.2 / -3.0) |
| search results do not carry ads |
19.4% (+3.0 / -2.7) |
| top of the left column |
9.2% (+2.5 / -2.0) |
| bottom of the left column |
7.6% (+2.4 / -1.9) |
Less than 3 in 10 answered the question correctly & nearly 20% of people do not think search results carry any ads, which explains how an algorithmic penalty can create a bad quarter, why Google was sued in Australia for misleading ads & why the Rosetta Stone vs Google case was overturned. Next time you hear a search engineer talk about clearly labeling paid links, ask them why they do such a poor job of it themselves!
User Trust in Ad Versus Organic Results
Ever since search engines have weeded out some of the more exploitative reverse billing fraud ads, trust in online ads has been growing. Based on the above, we wanted to see how users perceive ads vs organic search results, so I asked: Search engines include both algorithmic search results and ads in them. Which do you trust more?
| Answer |
All (1168) |
| I trust both equally |
45.8% (+3.3 / -3.2) |
| Algorithmic search results |
40.9% (+3.2 / -3.1) |
| Ads that appear in search results |
13.3% (+2.5 / -2.2) |
The above result surprised me given how people disliked money influencing search results. It is a strong compliment to the ads that only 40% of people trust the editorial more than the ads. However this number might be thrown off by the fact that many people are unaware of where the ads actually appear in the search results & what results are ads. (As noted above, most people voted that they thought that either search ads were only in the right column or that there weren't ads in the SERPs.)
Making Up for the Small Image Problem
One of the bigger issues with Google's current survey solution is that you are limited to rather small sized images. Such limitations do not harm asking a question like "what color does Google use for x" but they do make the search result a bit harder to see. To compensate for that problem we ran a separate survey on AYTM, where users were able to view a search result in full screen mode for 10 seconds & then they were asked 3 questions.
The purpose of the first question was to put a few seconds in between them seeing the image and them answering the second question. One other improvement that was made here (in addition to allowing users to see a larger sized search result image) was that we added an "I am not sure" answer to the questions. Below are the responses in table + graphic form, followed by the AYTM widget.
Where May Ads Appear on Google's Search Results Page?
| Location |
Vote |
| in the right column |
28.70% |
| top of the left column |
6.20% |
| bottom of the left column |
1.90% |
| middle of the left column |
2.30% |
| search results do not have ads in them |
6.80% |
| I am not sure |
18.90% |
| right column & the top + bottom of the left column |
35.20% |
Did the Viewed Search Result Have Any Ads On It?
| Answer |
Vote |
| I'm not sure |
41.00% |
| no |
12.40% |
| yes |
46.60% |
What Background Color Does Google Use to Denote Ads At the Top Left of Their Search Results?
| Answer |
Vote |
| none, they are white |
28.10% |
| blue |
20.80% |
| purple |
1% |
| I'm not sure |
22.60% |
| pink |
6.80% |
| yellow |
20.70% |
Even directly after viewing a search result with 3 ads in it, most users are uncertain of where ads may appear, what color the ads are, and if the search result even had any ads in it!
Users confusing the yellow background as white shortly after seeing it is anything but an accident:
In a RGB color space, hex #fef7e6 is composed of 99.6% red, 96.9% green and 90.2% blue. Whereas in a CMYK color space, it is composed of 0% cyan, 2.8% magenta, 9.4% yellow and 0.4% black. It has a hue angle of 42.5 degrees, a saturation of 92.3% and a lightness of 94.9%. #fef7e6 color hex could be obtained by blending #ffffff with #fdefcd. .
If you have an older monitor or a laptop which you are viewing at an angle these colors are nearly impossible to see.
Embed The AYTM Graph in Your Website
Here is the AYTM widget of the above 1,000 person survey, which you can embed in your website.
Embed Code:


