Setting Up Actionable SEO Dashboards in the New Google Analytics
There have been many mixed reviews about the latest Google Analytics UI. Putting the frustration of having to learn a new UI aside (here's a great guide to navigating the new Google Analytics interface), the new Google Analytics actually brings to the table great customization options. One of my favorites being custom dashboards.
Both the old and new interfaces offer a standard dashboard that acts as an overview of your analytics profile. But where the new UI has its advantage is with your ability to create your own dashboard - in fact, you can create up to 20 of them for each profile.
Creating Dashboards
The first thing we'll want to do is click the "+ New Dashboard" link on the left navigation of your profile's Home tab. Google will then ask you to name the dashboard and to choose either a "Blank Canvas" or a "Starter Dashboard." The Starter Dashboard is just like the default dashboard you already have in Google Analytics, so let's choose "Blank Canvas." Now it's time to populate your dashboard with widgets.
There are two ways you can customize your new dashboard:
- Use the "Add Widget" feature on your dashboard
- Navigate to the view you want in Google Analytics and click the "Add to Dashboard" link.
When you use the "Add Widget" feature, there are four types of widgets you can choose from:
- Metric - This will show you a single metric as well as a "sparkline" for that metric (which is basically a tiny line graph)
- Pie - Displays a breakdown of various metrics in pie chart form
- Timeline - A graph (only) of any metric (or compare two metrics) over any period of time
- Table - Your traditional Google Analytics table, but it can be customized to only display what you've setup (including filters)
You build each widget the same way you would segment/filter data in Google Analytics normally. The key here is saving the view to your dashboard so you can quickly login and review performance without having to set everything up again.
As you add more widgets to your custom dashboard, you can easily drag, drop and rearrange your widgets into one of the three dashboard columns.
Now that we know how to setup dashboards, let's take a look at some useful SEO dashboards you should consider creating.
SEO Monitoring Dashboard
The purpose of this dashboard is simple: a quick look into the health of your SEO campaign.
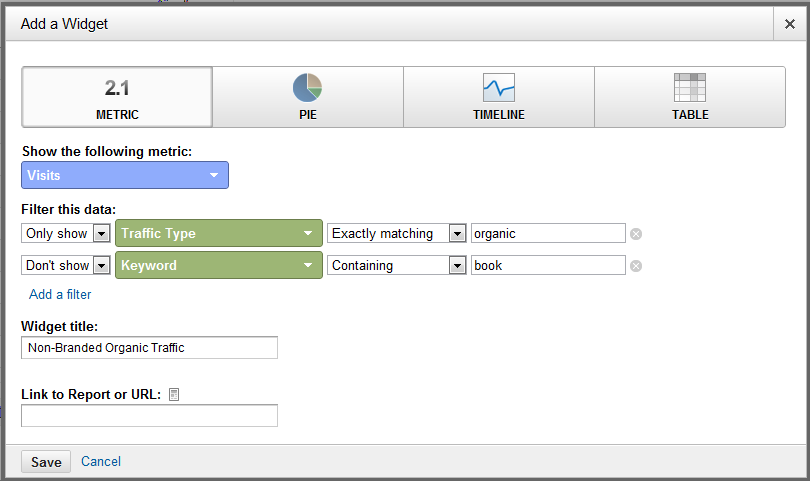
Widget #1: Total Organic Non-Branded Keyword Traffic (Metric/Timeline)
With this metric/timeline widget, we're simply wanting to look at our total number of organic, non-branded search traffic. Remember, with the metric widget, you can only look at a single metric. If you only want to see the total number of visits, add a metric widget. However, if you'd like to see the total visit count broken out over the selected date range, you'll want to add it as a timeline widget.
For this widget, we'll add a Metric/Timeline with the following dimensions:
Widget #2: Total Organic Non-Branded Keyword Conversions (Metric/Timeline)
In this widget we're looking to get a snapshot of just how many total conversions (or transactions) that have been generated by our non-branded organic keyword referrals.
For this widget, we'll add a Metric/Timeline with the following dimensions:
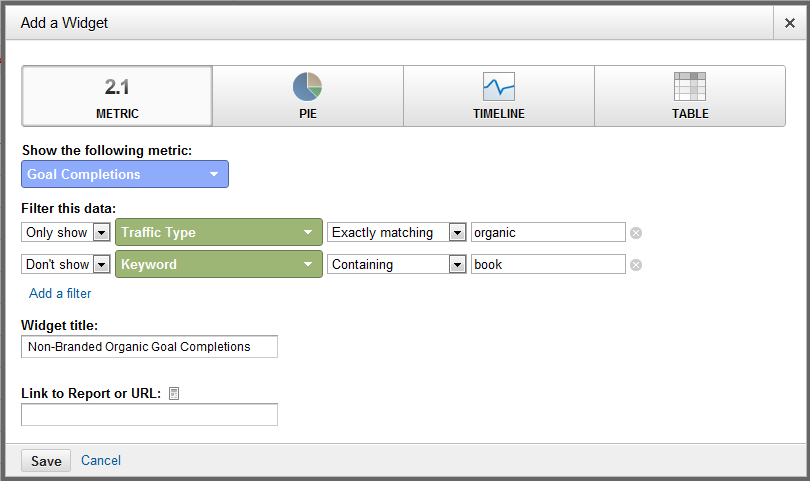
Just like before, if you'd prefer to see this over time you can change this widget to be a timeline instead of a metric widget.
Widget #3: Total Organic Non-Branded Keyword Traffic (Table)
This widget filters out your branded search keyword referrals so you can get right to the keywords you're most interested in. You may also consider adding an additional filter to remove (not provided) if it takes up a significant number of the results.
For this widget, we'll add a Table with the following dimensions:
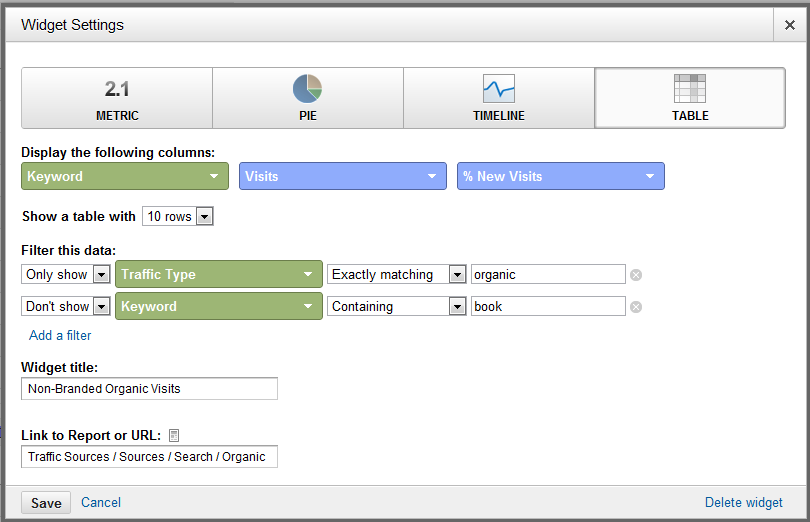
You'll notice that I didn't choose any goals for the secondary metric. We'll cover that in the next widget. For now, we want to get a good understanding of what keywords are driving
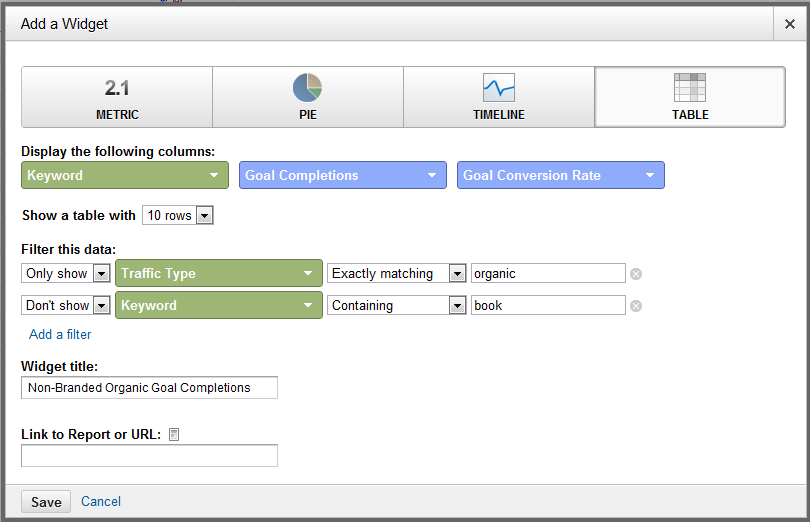
Widget #4: Total Organic Non-Branded Keyword Conversions/Transactions (Table)
In this widget we're looking to get a quick look at our top converting/transaction keywords. Once again, I recommend filtering out your branded search terms. Depending on how many important conversion points you want to keep track of, you may need to add more than one widget of this type because you can only view two metrics in each Table widget.
For this widget, we'll add a Table with the following dimensions:
Widget #5: Top Social Action Content (Table)
You'll find it easier to navigate to this report in the Standard Reporting section of Google Analytics (Audience > Social > Pages) and adding the widget using the top navigation bar in Google Analytics. The goal of this particular widget is to quickly see which content on your site is getting shared the most in social media. That way you'll know what content topics have the best chance of going viral.
By default Google will show you information for only Google+, in a future post I'll walk you through how to get other sites like Twitter and Facebook setup on here, too.
If your blog content lives under a /blog/ subfolder, you may want to consider filtering the report to only look at that content.
For this widget, we'll add a Table with the following dimensions:
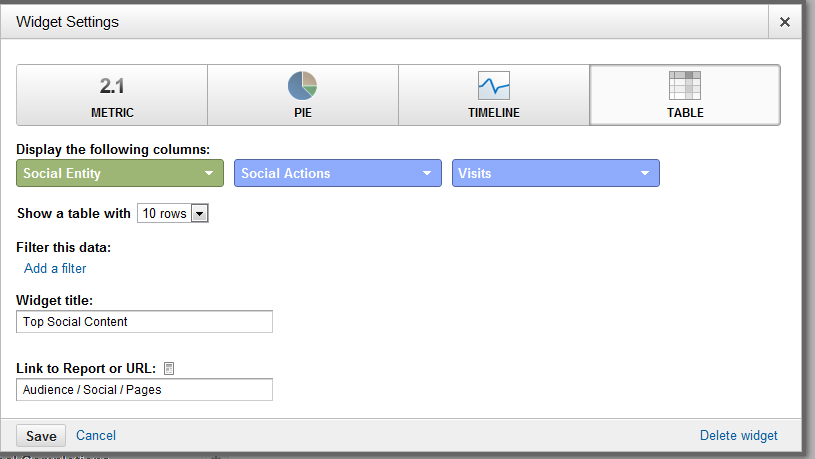
After I added the widget to our SEO Monitoring dashboard, I went back and edited it to also include total visits as well.
Widget #6: Top Content Traffic & Conversions (Table)
In addition to knowing what content is getting shared the most, I like to keep an eye on what blog content is getting the most traffic and conversions.
For this widget, we'll add a Table with the following dimensions:
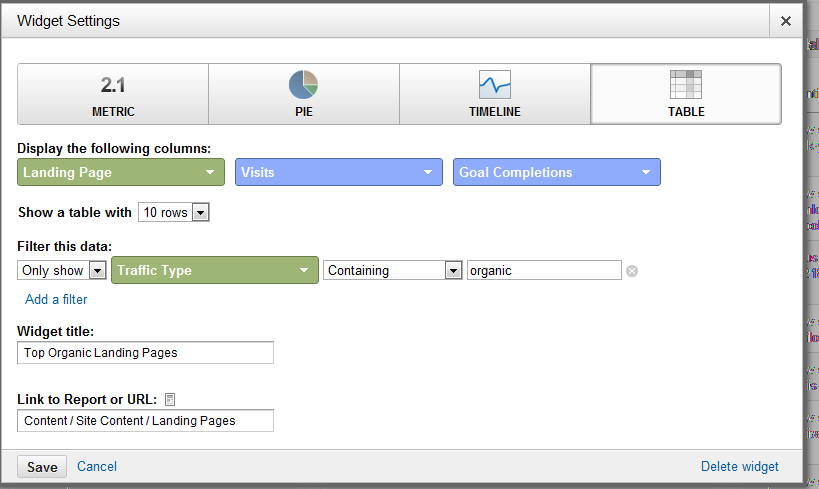
Don't forget to filter in just your blog content if that is the area you want to focus on.
Widget #7: Organic Search Engine Referrals (Pie)
I like to keep an eye on which search engines are sending me traffic and how it changes over time. The best way to get a snapshot of this is to add a pie chart widget.
For this widget, we'll add a Pie with the following dimensions:
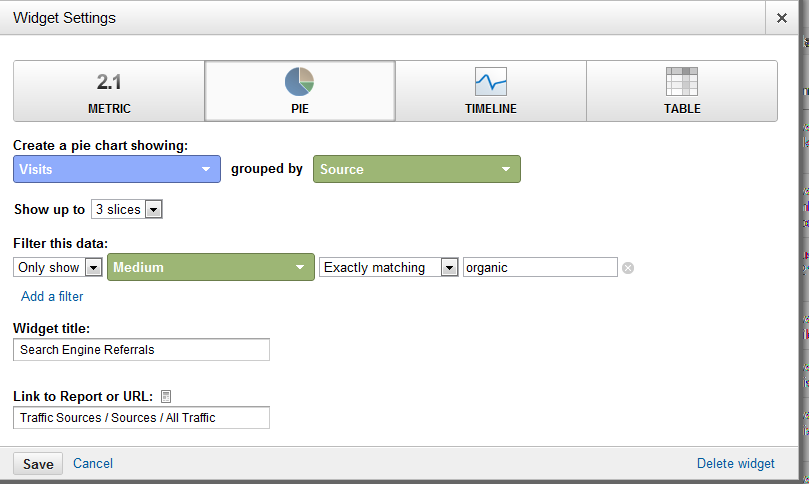
I chose to only look at the top three organic search engine referrals, but you can select up to six for your pie chart.
Widget #8: Page Load Speed (Table)
We also need to keep an eye on any pages that are loading slow. We can actually setup the widget to only look at organic traffic page load speeds, although it would be in your best interest to look at all your content, not just that just with organic visits.
For this widget, we'll add a Table with the following dimensions:
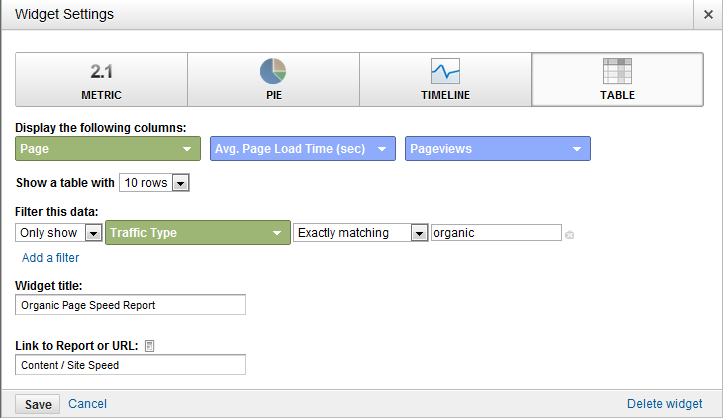
The above table shows you your top ten slowest loading landing pages, and also includes how many visits that pages receives. You can sort by either, but it's probably best to tackle the pages with the slowest load time first.
Widget #9: Site Search Keywords (Table)
The final piece to our monitoring puzzle: a list of keywords being searched for the most on our internal site search. This is a great way to generate new keyword ideas and to find new usability ideas (more on that later).
For this widget, we'll add a Table with the following dimensions:
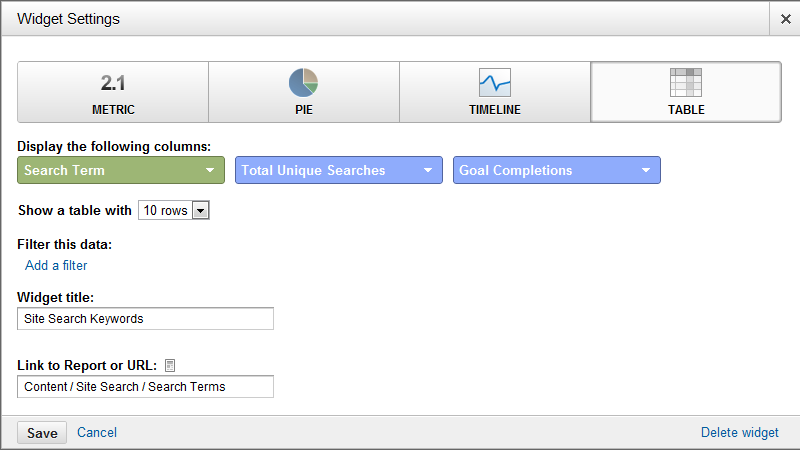
I also like to add conversions as a dimension to this widget so I can not only keep an eye on which terms are getting searched for the most, but also which lead to the most conversions.
Website Redesign Dashboard - SEO Focus
So it's time for the dreaded redesign process. You have a pretty good idea of what's ahead: long nights, lots of frustration and hopefully, a great looking website not too far down the line. With this dashboard you can quickly gain insight into what changes you should be making in the upcoming redesign to help out your SEO campaign.
You might also consider renaming this dashboard to be a Usability dashboard so you can frequently check-in on how well your site is performing for your visitors.
We'll be borrowing a few of the widgets in our SEO Monitoring dashboard, but also adding a few. Let's first look at which widgets we should be re-adding to this new dashboard:
Widget #1: Top Converting Keywords (SEO Monitoring Widget #2)
A website redesign offers a great opportunity for keyword inclusion throughout our site's architecture (navigation, URLs, etc.) With this widget we can keep an eye on which keywords we should be focusing these optimization efforts on.
Widget #2: Top Social Action Content (SEO Monitoring Widget #5)
Which social networks are engaging the most with your content? What pages are getting the most engagements? Answering these questions will help you create a user experience that is not only tailored to your top social network traffic drivers, but that also encourages social sharing.
You'll also want to look closely at what makes the content in this report so shareable. Is it because of the way they are laid out? The images they use? These insights can really help you carry that experience throughout your new site.
Widget #3: Top Converting Content (SEO Monitoring Widget #6)
Just like with the top social action content, you want to keep an eye on the content that is working best (and worst). This will allow you to duplicate your successes and (hopefully) eliminate your failures.
Widget #4: Page Load Speed (SEO Monitoring Widget #8)
The redesign is the perfect time to address page load speed problems. Take a look at the slowest rendering pages in this table and determine what the common problems are that are slowing the load speed down.
Widget #5: Site Search Keywords (SEO Monitoring Widget #9)
Site search is great for finding new keywords, it's also a great way to figure out what problems people are having navigating your site. With this widget you can quickly see the types of content people are expecting to find on your site - but aren't able to.
On to our new widgets!
Widget #6 & #7: SEO Geographic Summary (Table) & Language (Table)
Is it time to consider translating your site for a new geographic audience? This type of change will definitely need your attention as an SEO. It's also an opportunity for you to branch out your link building into new languages.
For this widget, we'll add a Table with the following dimensions:
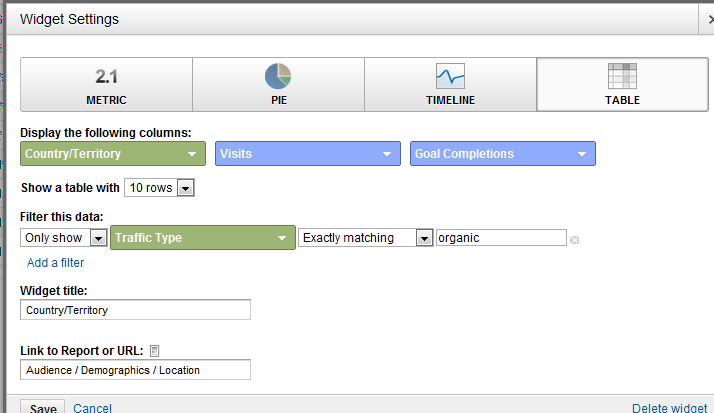
The organic traffic filter I have in place is definitely optional. I think it helps keep the data set you're looking at more consistent by restricting it to organic visits only like the other widgets are set to.
For the Language widget, we'll add a Table with the following dimensions:
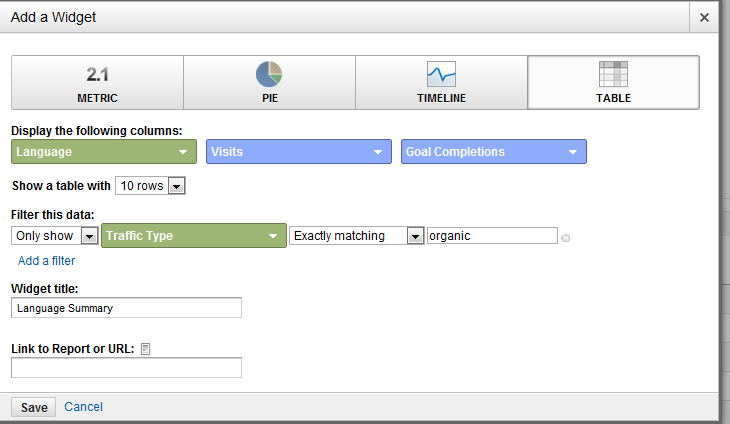
You'll note that I also filtered out all non-organic traffic here, too.
Widget #8: Top Exit/Bounce Pages (Table)
For this particular widget, we're once again trying to identify problem pages. Any pages that have a high exit/bounce rate should get a close review to see if the cause for people leaving can easily be identified.
For this widget, we'll add a Table with the following dimensions:
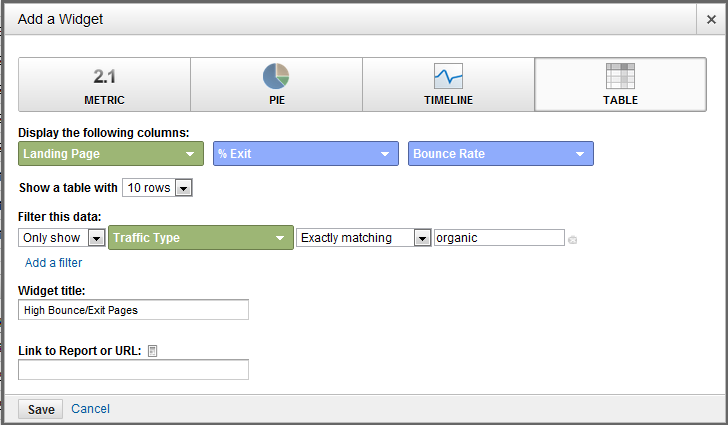
It's important that we filter out any blog content that naturally creates high bounce rates. If you also have an event like a Account Login on your site, you may wish to use Google's Event Tracking to filter out those visits as well.
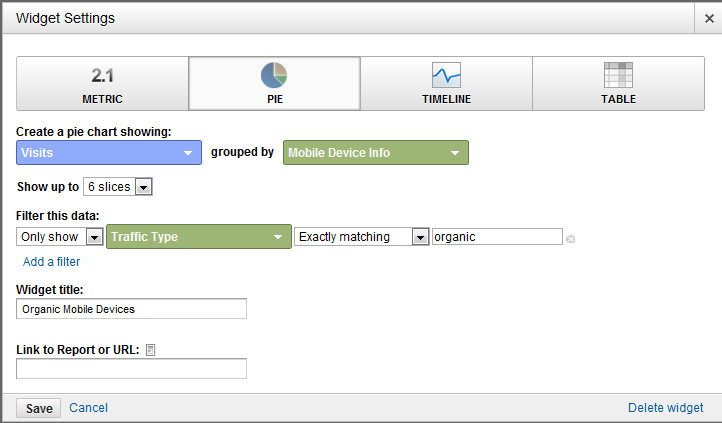
Widget #9: Mobile Devices (Pie)
Which mobile devices are your visitors using to access your site? Are you getting a substantial number of visits? Do you anticipate it growing during the life of the next site design? More than likely this will be an area of focus for your redesign. It's important that you know exactly which devices your consumers are using to view your site so you can ensure compatibility.
For this widget, we'll add a Pie with the following dimensions:
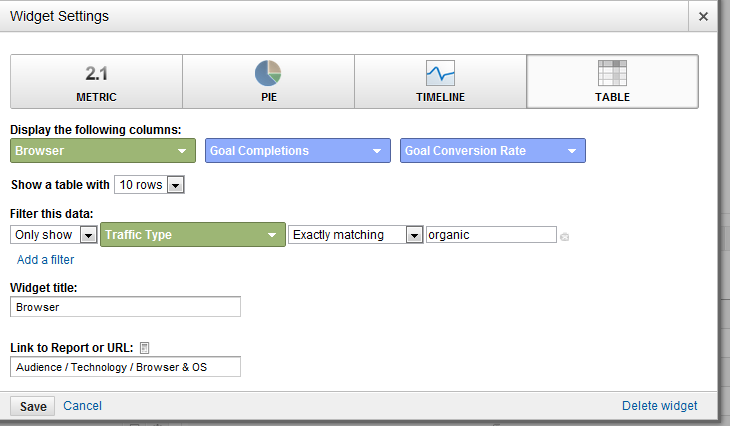
Widget #10: Browser Conversion Rate (Table)
Finally, I like to take a look into what browser our visitors are using most, and what their conversion rate currently is. We all say we test all browsers for compatibility, but there are always pages that were rushed or that just fell through the cracks that might not be presenting themselves the way you had hoped.
For this widget, we'll add a Pie with the following dimensions:
Holistic Dashboard
It's no secret that to succeed in today's online marketing world you need to be doing more than just SEO. Not just from the sense that other marketing efforts can help drive in new leads, but because it helps your SEO campaign succeed.
This dashboard highlights how your PPC and social media efforts are performing, so you can take that information and apply it to your SEO campaigns.
Widget #1: Top Social Action Content (SEO Monitoring Widget #5)
This widget will allow us to keep track of what types of content are performing best from a social perspective.
Widget #2: Top Referral Conversion/Transaction Sources (Table)
Within this report we'll be able to quickly see which social networks are the most profitable in terms of conversions and/or actual transactions. This is a great way to see which social networks respond well to your offering, and that you should be investing more time in.
For this widget, we'll add a Table with the following dimensions:
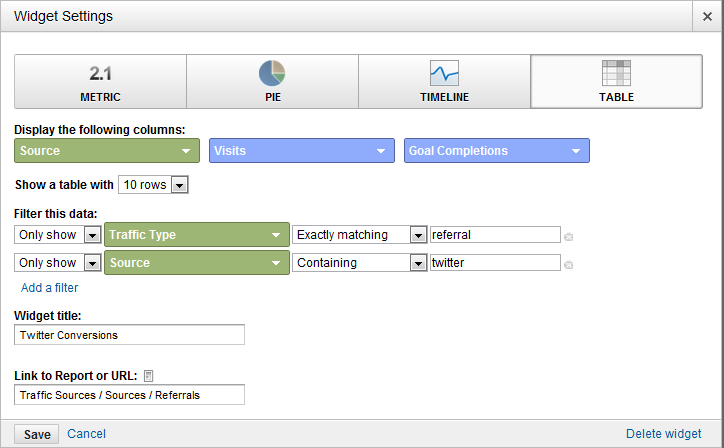
Ideally you'll want to setup a filter to only look at social networks. If you're good about tagging your URLs with custom variables, then you can change the filter to look at the medium and enter the medium value you use for social URLs (example: social).
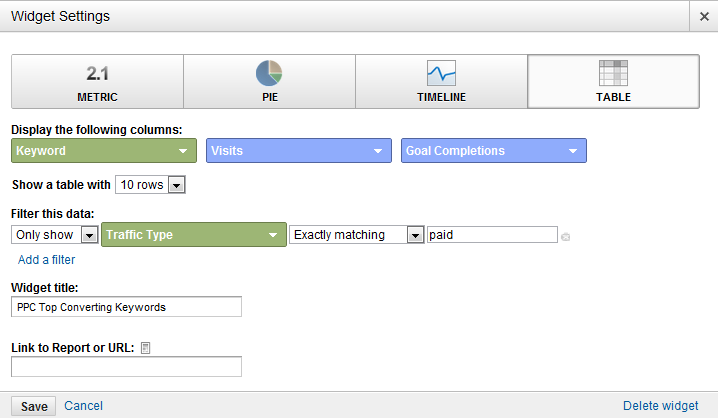
Widget #3: Top Paid Converting/Transaction Keywords (Table)
Ever since the (not provided) update, we've all lost out on valuable keyword data. But just as Google hoped we would, we can get this information from our PPC spend. With this widget we'll look at the keywords that are driving the most conversions/transactions for our PPC marketing, so we can look into targeting them in our SEO marketing, too.
For this widget, we'll add a Table with the following dimensions:
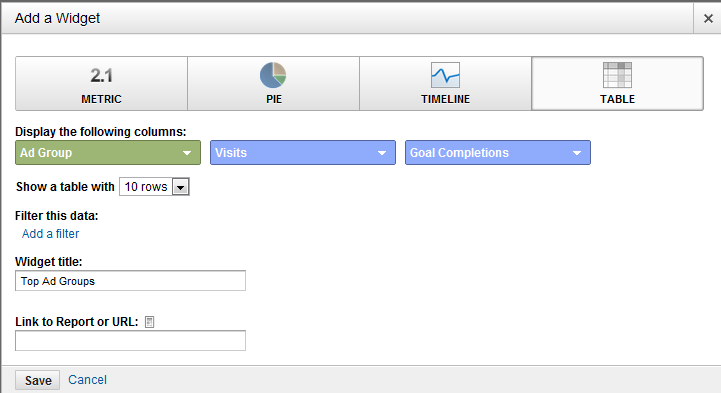
Widget #4: Top Paid Revenue Generating Ad Groups
Just like with our previous keyword widget, I also like to look at the top performing ad groups. This is a good way to know what top level topics are performing the best for your paid search campaigns, so you can prioritize them in your SEO campaigns.
For this widget, we'll add a Table with the following dimensions:
Widget #5: Top Paid Landing Pages (Table)
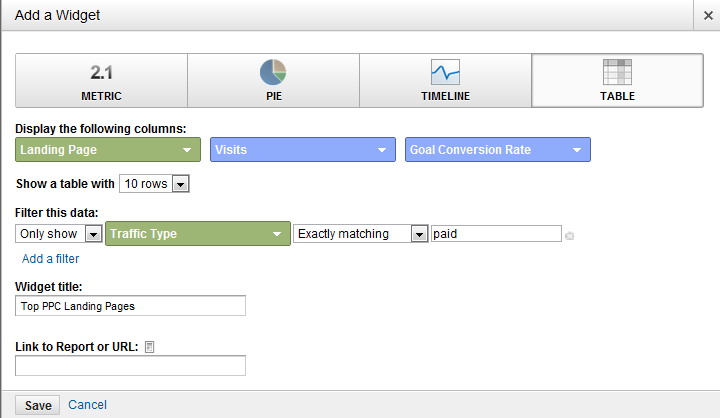
If you're not using custom landing pages for your paid search campaigns, this is a great way to see which keywords are working best for the various pages on your site. I like to run these types of tests before I commit to any keywords for SEO.
For this widget, we'll add a Table with the following dimensions:
That's just three of the 20 dashboards you could setup in Google Analytics. What are you adding to your dashboards to make them more actionable?


Comments
that's an extensive list you made there - nice job
Aaron, I'm having difficulty setting up goals on a particular site. 7 white paper lead gen forms and a "get a quote" form. Problem is the developer has them all going to 1 thank you page. Does that mean I can really only have 1 goal setup in GA?
You might consider just using event tracking to keep track of your forms. Basically, you don't need to have a thank you page for event tracking, you just record the conversion when someone clicks the submit button. If you're not familiar with setting them up, this is a free tool I helped create that should walk you through the process:
http://gaconfig.com/google-analytics-event-tracking/
This is a great list. Thank you for providing this. One question on perspective - Do you prefer first or last touch attribution for conversions? I'm finding that some of our landing pages with the best visit to lead conversion rates are only getting found by our repeat visitors.
For example, we have a word that has a 50%+ visit to lead conversion rate, but 50% of the visitors for that keyword are repeat visits to the site. What do you think about attribution for the leads to a particular source?
Glad you enjoyed it! Great question about attribution. I look at both first and last touch attribution, but I pay extra attention to first touch. Have you seen the assisted conversions report in Google Analytics? It's a great way to look at first touch attribution. Having a strong understanding of first touch will allow you to see which marketing efforts are having the biggest impact on your conversions overall.
I also like to look at the last touch so I can try to determine what caused them to buy on their latest visit. Could be because of the stage in their buying process, or could be because at first touch they didn't find all the information they were looking for.
Combine these great dashboards with some Regular Expressions, and you will save a whole lot of time pulling data. Especially the branded vs non-branded stats can have a lot of variations of your brand you don't want to spell out individually!
That's a great point Dennis, maybe a great future post too to make sure everyone has brushed up on their expressions :)
Great post! Do I have to create the dashboard from scratch for every client, and for every user? Is there a way to copy the dashboard to other accounts, and to share it with other users?
Hi great post. I will be using this for my clients and I want to know if it is ok if I make a tutorial video series on this linking to this post and giving you full credit?
Thanks
sure that is fine :)
Are you able to create one generic dashboard and attach it to each profile in your GA account? This would save time setting up the same dashboard for each client. Obviously we'd need to amend each one slightly to fit with the clients goals.
I tested it on a few accounts and didn't see the dashboards come through, unfortunately. Only solution I can think of is to create a shared login for it, but that's not ideal. I'll let you know if I dig up a better solution!
Taylor Pratt,
All I can say is thank you. This blog post is absolutely phenomenal. Excellent stuff!
That's really nice of you to say! Glad you enjoyed it and found it helpful. Let me know what other dashboard widgets you come up with!
Taylor, you noted that you'll have a future post to explain how to add twitter and facebook to the social tracking. Any idea when you'll make this post? I'd love to strat tracking this information ASAP. Thanks!
I should have it up in the next few weeks but would be happy to shoot you the details via email. taylor [at] builttosearch [dot] com
Looks like with the latest GA interface update you can now share your dashboards! Here's a nice blog post that recaps the changes: http://www.johnfdoherty.com/redesigned-analytics/
Hey Taylor, this is a great tutorial. Since these report templates can now be shared would you mind sharing this template for all to use? It would save valuable time. Thanks!
http://www.seobook.com/maximizing-google-analytics-insight-seo-custom-re...
do those work for you?
Add new comment