MULTI-DIMENSIONAL SCALING
The Big Picture
In our discussion of information retrieval, we have been talking about searches that give textual results - we enter queries and phrases as text, and look at results in the form of a list. In this section, we will be looking at an annex technology to LSI called multi-dimensional scaling, or MDS, which lets us visualize complex data and interact with it in a graphical environment. This approach lets us use the advanced pattern-recognition software in our visual cortex to notice things in our data collection that might not be apparent from a text search.
Multi-dimensional scaling, or MDS, is a method for taking a two- or three-dimensional 'snapshot' of a many-dimensional term space, so that dimensionally-challenged human beings can see it. Where before we used singular value decomposition to compress a large term space into a few hundred dimensions, here we will be using MDS to project our term space all the way down to two or three dimensions, where we can see it.
The reason for using a different method ( and another three-letter acronym ) has to do with how the two algorithms work. SVD is a perfectionist algorithm that finds the best projection onto a given space. Finding this projection requires a lot of computing horsepower, and consequently a good deal of time. MDS is a much faster, iterative approach that gives a 'good-enough' result close to the optimum one we would get from SVD. Instead of deriving the best possible projection through matrix decomposition, the MDS algorithm starts with a random arrangement of data, and then incrementally moves it around, calculating a stress function after each perturbation to see if the projection has grown more or less accurate. The algorithm keeps nudging the data points until it can no longer find lower values for the stress function. What this produces is a scatter plot of the data, with dissimilar documents far apart, and similar ones closer together. Some of the actual distances may be a little bit off ( since we are using an approximate method), but the general distribution will show good agreement with the actual similarity data.
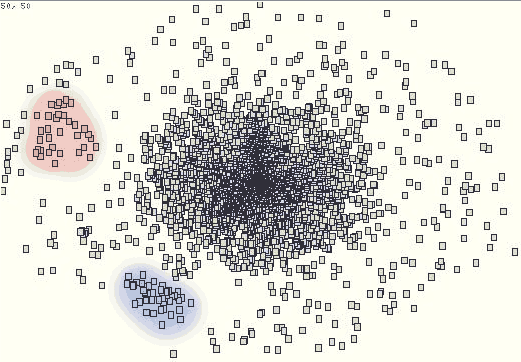
To show what this kind of projection looks like, here is an example of an MDS graph of approximately 3000 AP wire stories from February, 2002. Each square in the graph represents a one-page news story indexed using the procedures described earlier:
|
Figure 1: MDS of News Wire Stories for Feb. 2002 |

|
MDS graph of 3,000 AP wire stories from the
month of February, 2002. Each square is a single story. Colored areas
indicate topic clusters discussed below. |
As you can see, the stories cluster towards the center of the graph, and thin out towards the sides. This is not surprising given the nature of the document collection - there tend to be many news stories about a few main topics, with a smaller number of stories about a much wider variety of topics.
The actual axes of the graph don't mean anything - all that matters is the relative distance between any two stories, which reflects the semantic distance LSI calculates from word co-occurence. We can estimate the similarity of any two news stories by eyeballing their position in the MDS scatter graph. The further apart the stories are, the less likely they are to be about the same topic.
Note that our distribution is not perfectly smooth, and contains 'clumps' of documents in certain regions. Two of these clumps are highlighted in red and blue on the main MDS graph. If we look at the articles within the clumps, we find out that these document clusters consist of a set of closely related articles. For example, here is the result of zooming in on the blue cluster from Figure 1:
|
Figure 2: Closeup of Cluster 1 |

|
Closeup of document cluster shown in blue in
Figure 1. Text shows first 30 characters of story headline. Note how
articles are grouped by topic. |
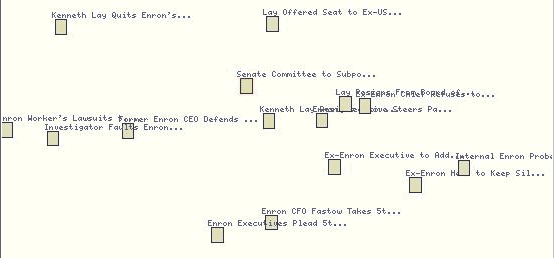
As you can see, nearly all of the articles in this cluster have to do with the Israeli-Palestinian conflict. Because the articles share a great many keywords, they are bunched together in the same semantic space, and form a cluster in our two-dimensional projection. If we examine the red cluster, we find a similar set of related stories, this time about the Enron fiasco:
|
Figure 3: Closeup of Cluster 2 |

|
Closeup of red document cluster from Figure 1. Text shows first 30 characters of story headline. |
Notice that these topic clusters have formed spontaneously from word co-occurence patterns in our original set of data. Without any guidance from us, the unstructured data collection has partially organized itself into categories that are conceptually meaningful. At this point, we could apply more refined mathematical techniques to automatically detect boundaries between clusters, and try to sort our data into a set of self-defined categories. We could even try to map different clusters to specific categories in a taxonomy, so that in a very real sense unstructured data would be organizing itself to fit an existing framework.
This phenomenon of clustering is a visual expression in two dimensions of what LSI does for us in a higher number of dimensions - reveals preexisting patterns in our data. By graphing the relative semantic distance between documents, MDS reveals similarities on the conceptual level, and takes the first step towards organizing our data for us in a useful way.
< previous next >
This work is licensed under a Creative Commons License. 2002 National Institute for Technology in Liberal Education. For more info, contact the author.
Gain a Competitive Advantage Today
Your top competitors have been investing into their marketing strategy for years.
Now you can know exactly where they rank, pick off their best keywords, and track new opportunities as they emerge.
Explore the ranking profile of your competitors in Google and Bing today using SEMrush.
Enter a competing URL below to quickly gain access to their organic & paid search performance history - for free.
See where they rank & beat them!


